#05 · 2020
ITSM App Deployment vs. Renewal Performance
Analysis (employer work, de-identified)Customer success analytics · Threshold analysis · Sentiment analysis · Logistic regression
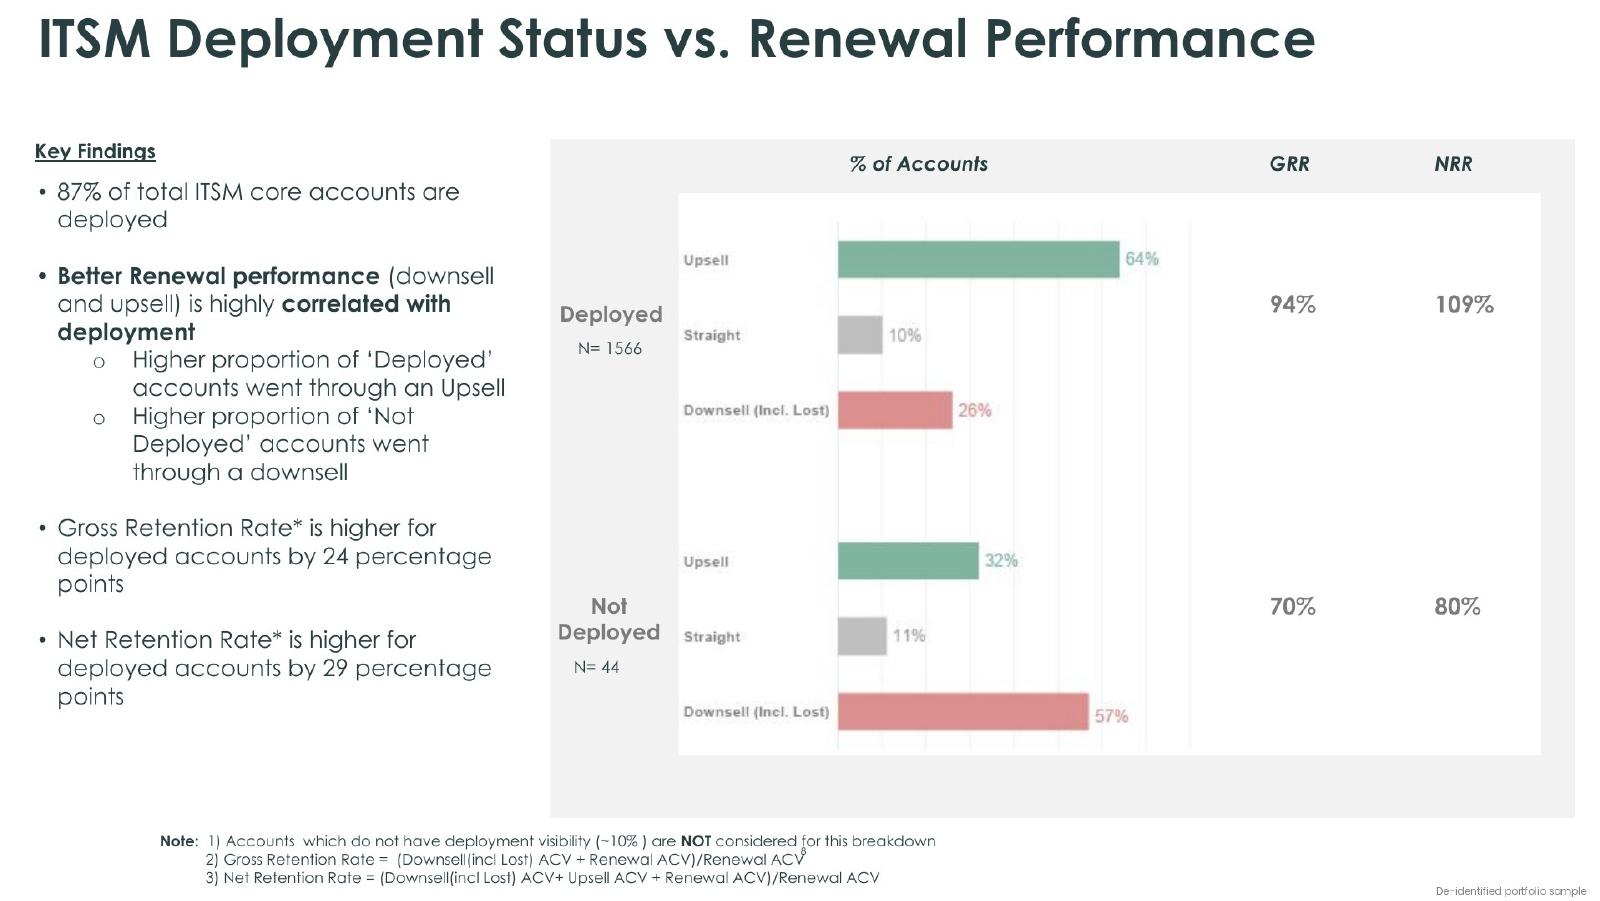
94% vs 70%
GRR deployed vs. undeployed
50%
deployment tipping point for upsell
+75%
upsell odds with Request Mgmt
my_role: Individual Contributor (IC) - defined the proxy metric, built the deployment tagging, ran threshold, sentiment and regression analyses, and presented findings to customer success leadership.
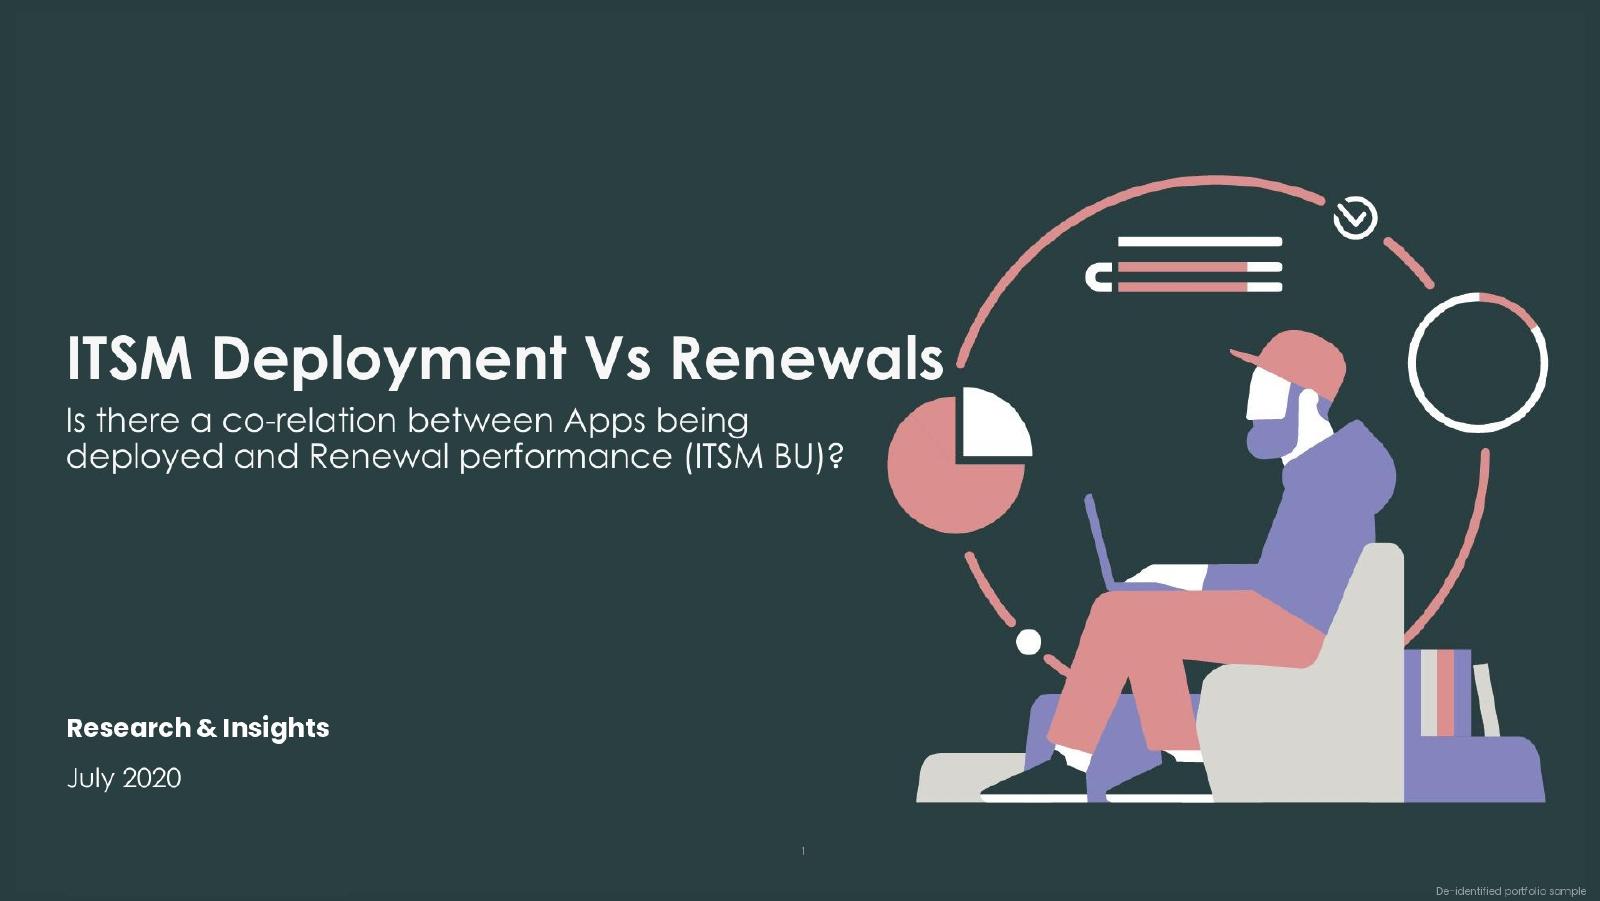
Is there a correlation between apps being deployed and renewal performance? A research & insights study for an ITSM business unit, combining deployment threshold analysis, sentiment analysis of engagement surveys, and logistic regression to show which deployments drive upsell and retention.
## The question
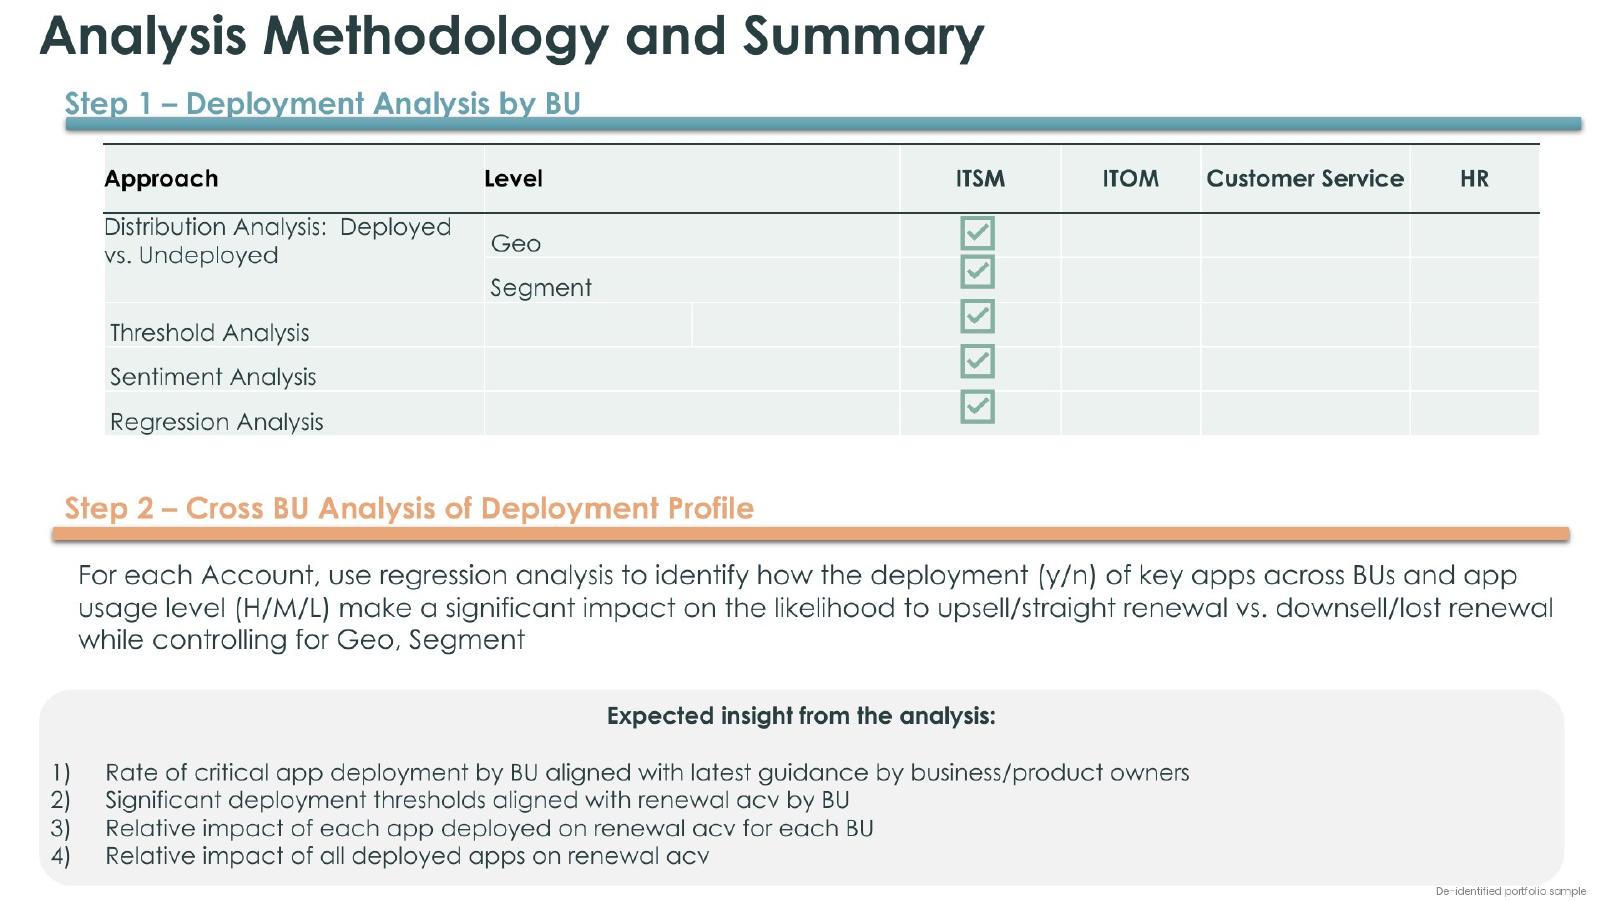
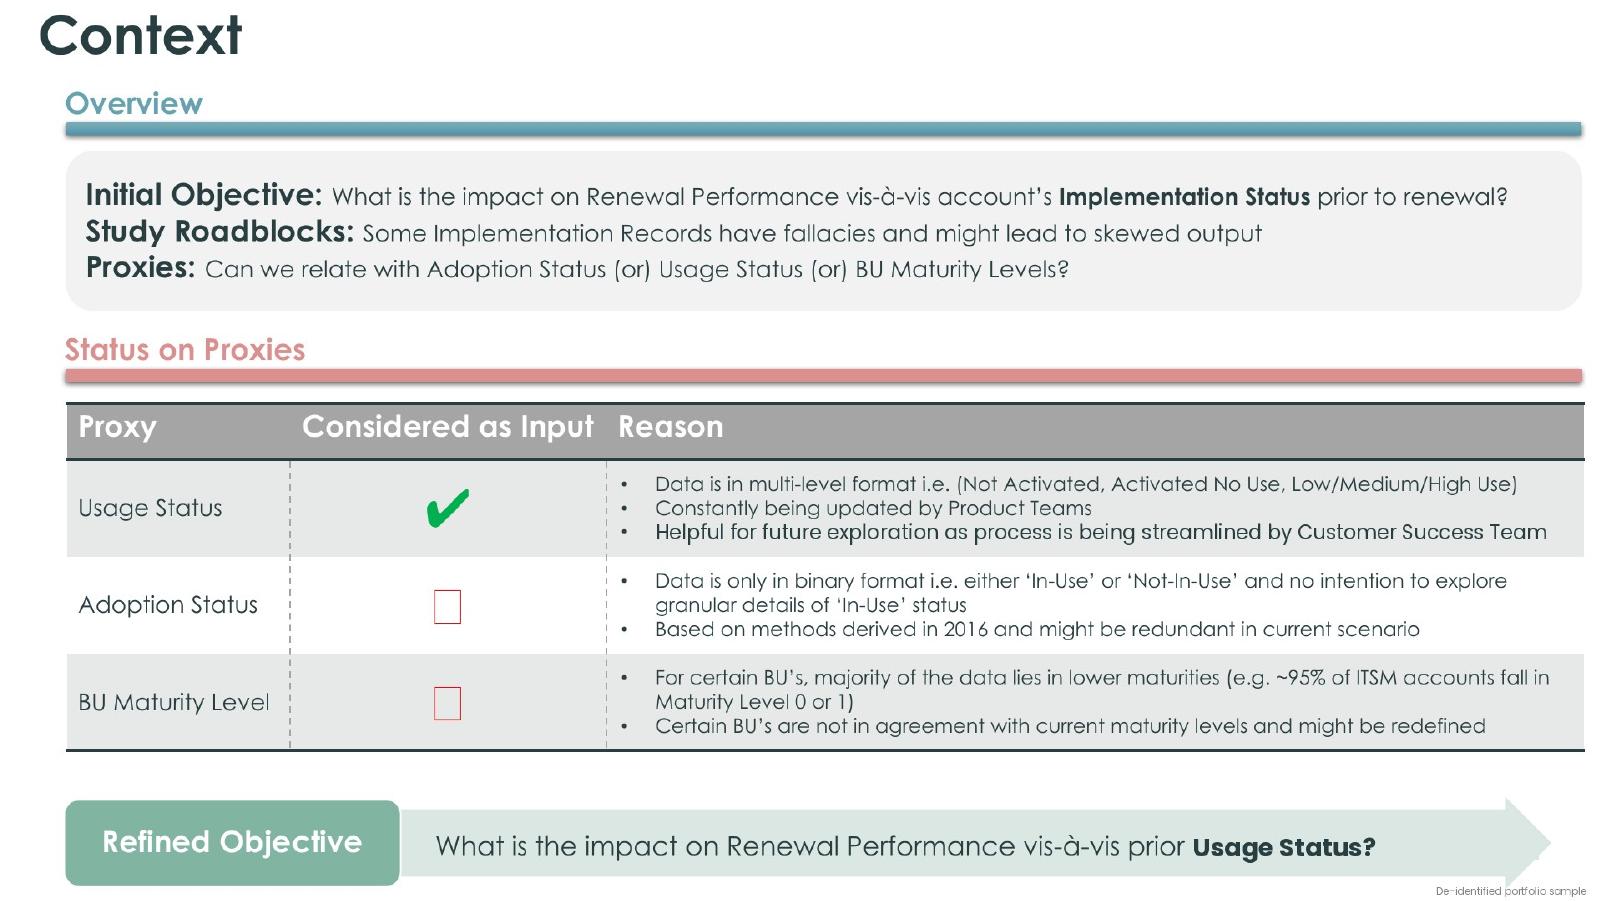
Is there a correlation between apps being deployed and renewal performance for the ITSM business unit? The initial objective - renewal performance versus implementation status - hit a roadblock: some implementation records had fallacies that could skew the output. Adoption status was binary only, and BU maturity levels were outdated (~95% of ITSM accounts sat at level 0 or 1). Usage status, multi-level and constantly updated by product teams, became the proxy. Refined objective: what is the impact on renewal performance vis-à-vis prior usage status?
## Data & methodology
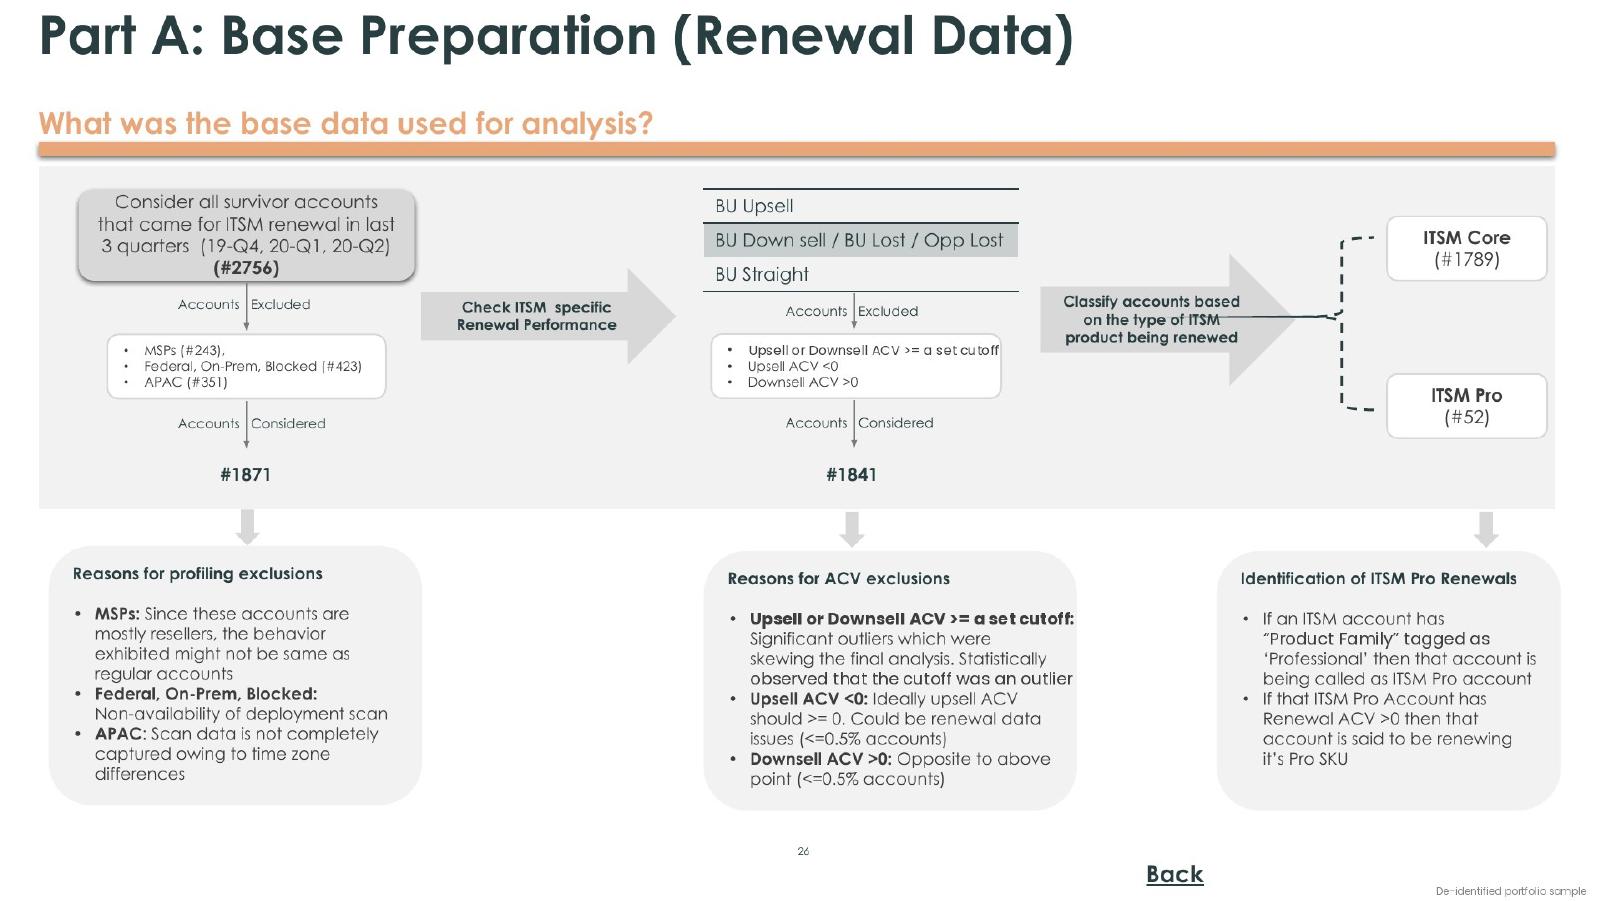
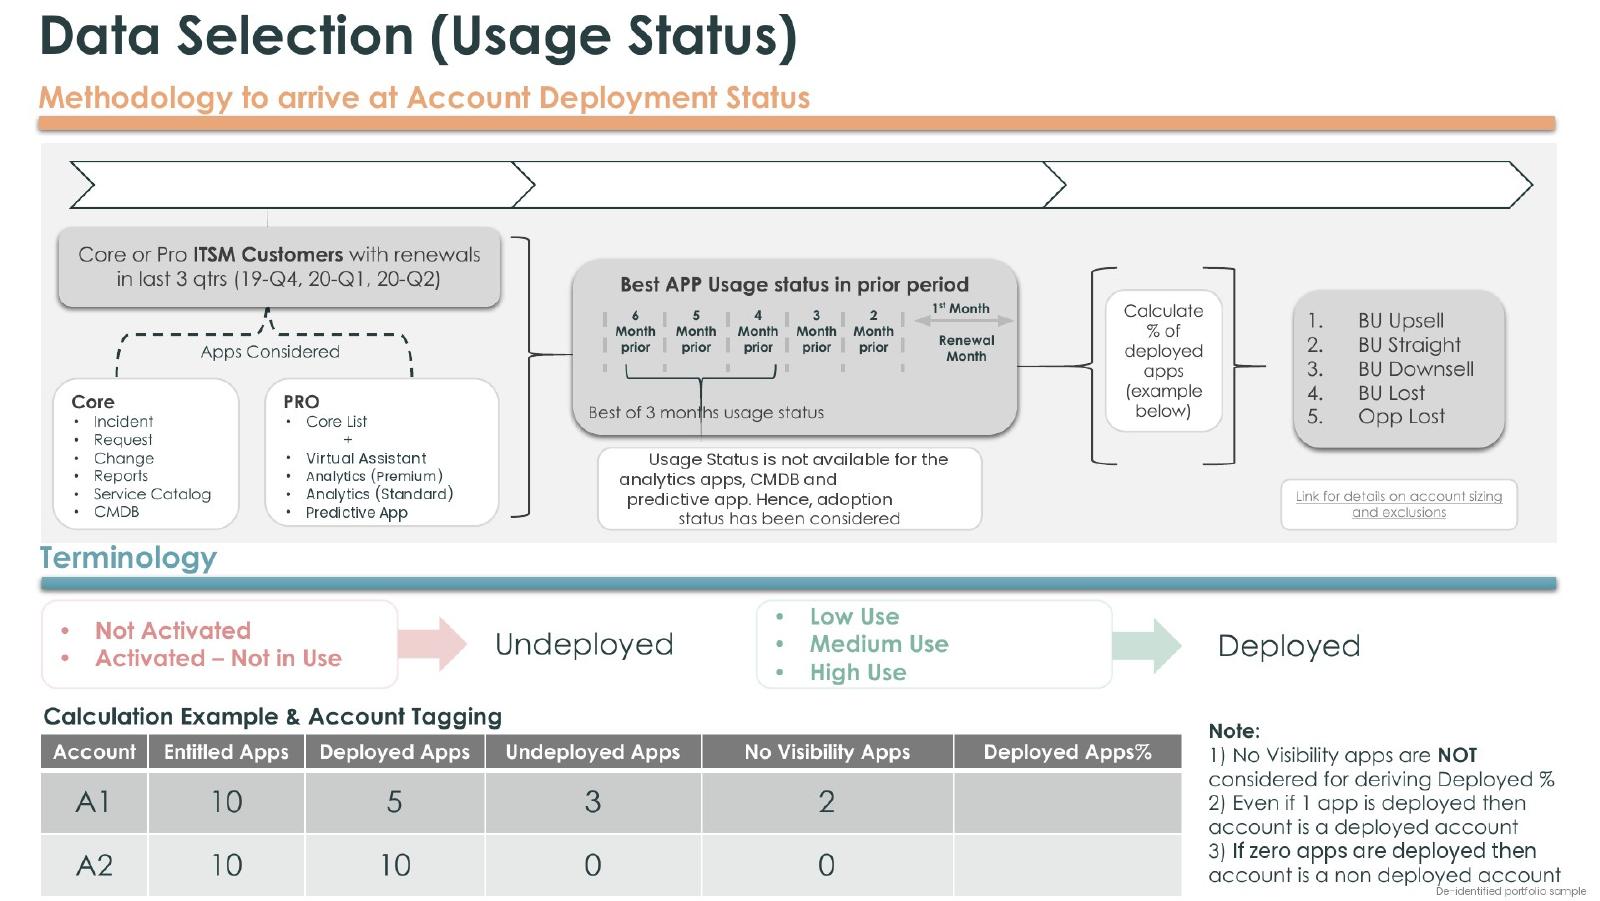
- ›Core and Pro ITSM customers with renewals in the last three quarters (19-Q4, 20-Q1, 20-Q2)
- ›Best app usage status over the three months before renewal, per entitled app (Incident, Request, Change, Service Catalog, CMDB, Analytics, Virtual Assistant, Predictive)
- ›Not Activated / Activated–Not in Use = undeployed; Low / Medium / High Use = deployed
- ›An account with at least one deployed app is a deployed account; no-visibility apps are excluded from deployed %
- ›Excluded MSPs, Federal/On-Prem/Blocked, APAC (incomplete scan data) and ACV outliers at a set cutoff
- ›Renewal outcomes: BU Upsell, BU Straight, BU Downsell, BU Lost, Opp Lost
## Summary of key findings
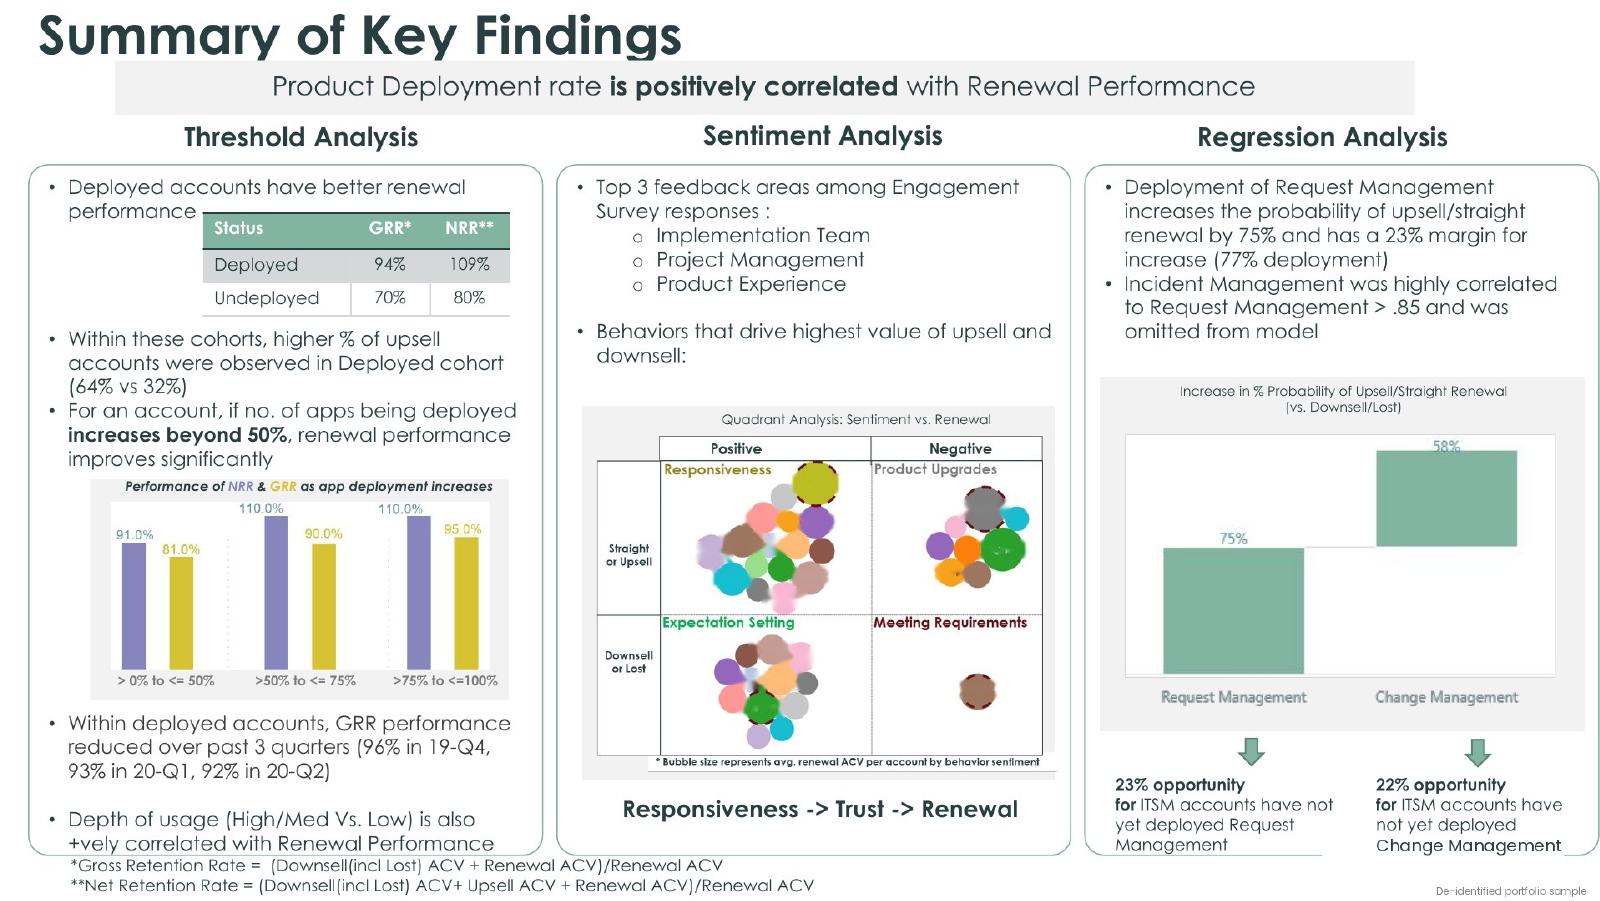
- ›Product deployment rate is positively correlated with renewal performance
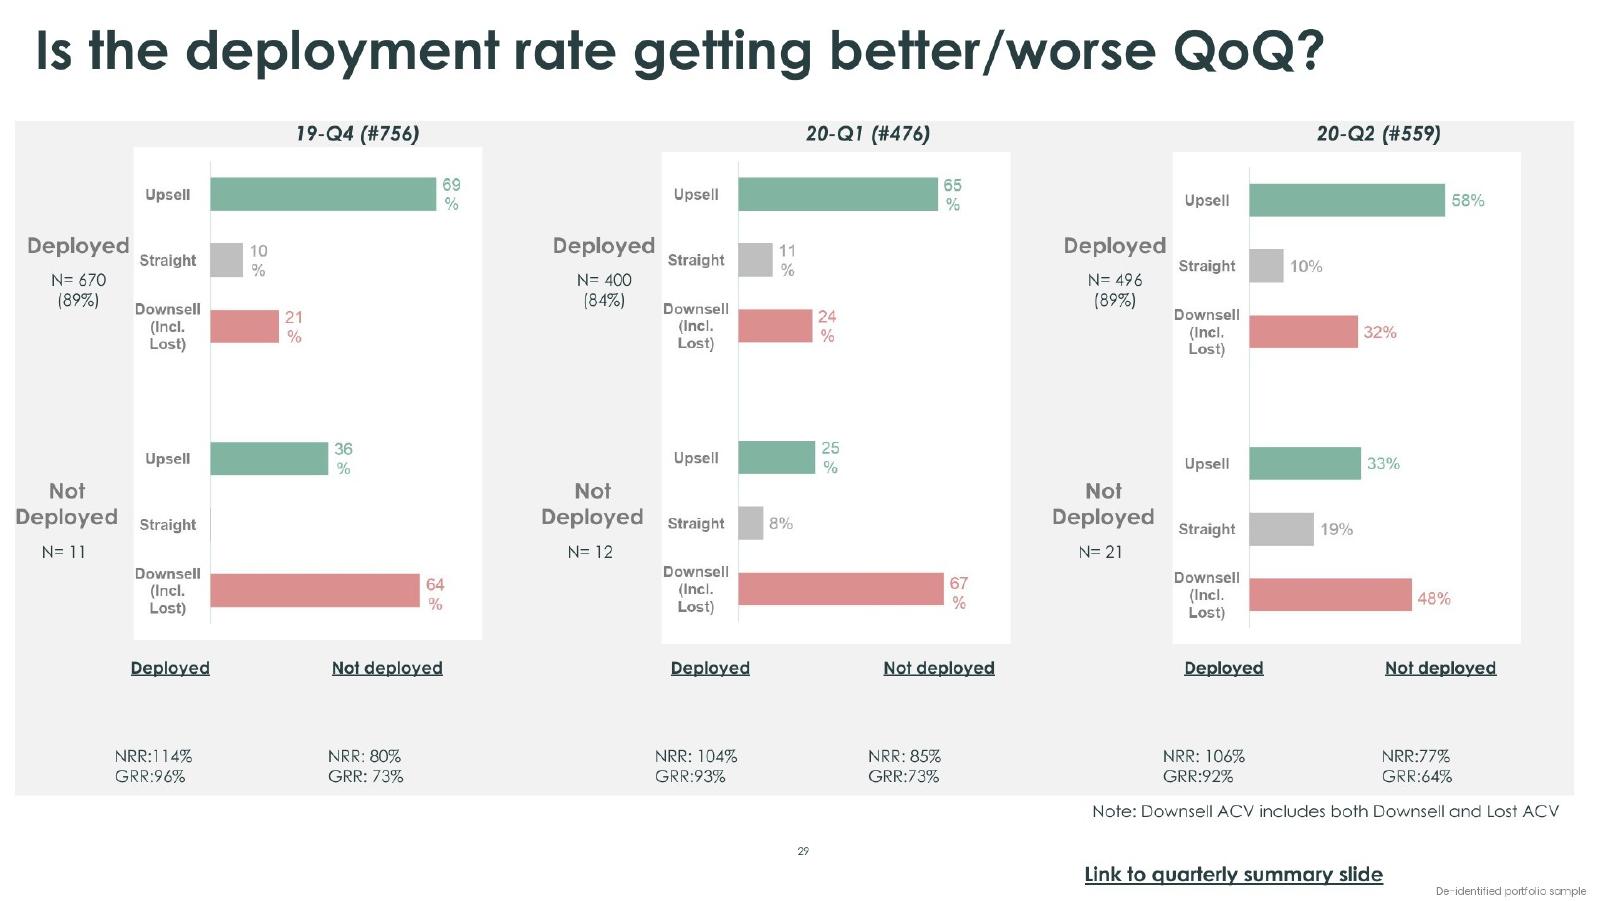
- ›Deployed accounts: 94% GRR / 109% NRR vs. undeployed: 70% / 80%
- ›Upsell share is higher in the deployed cohort (64% vs. 32%)
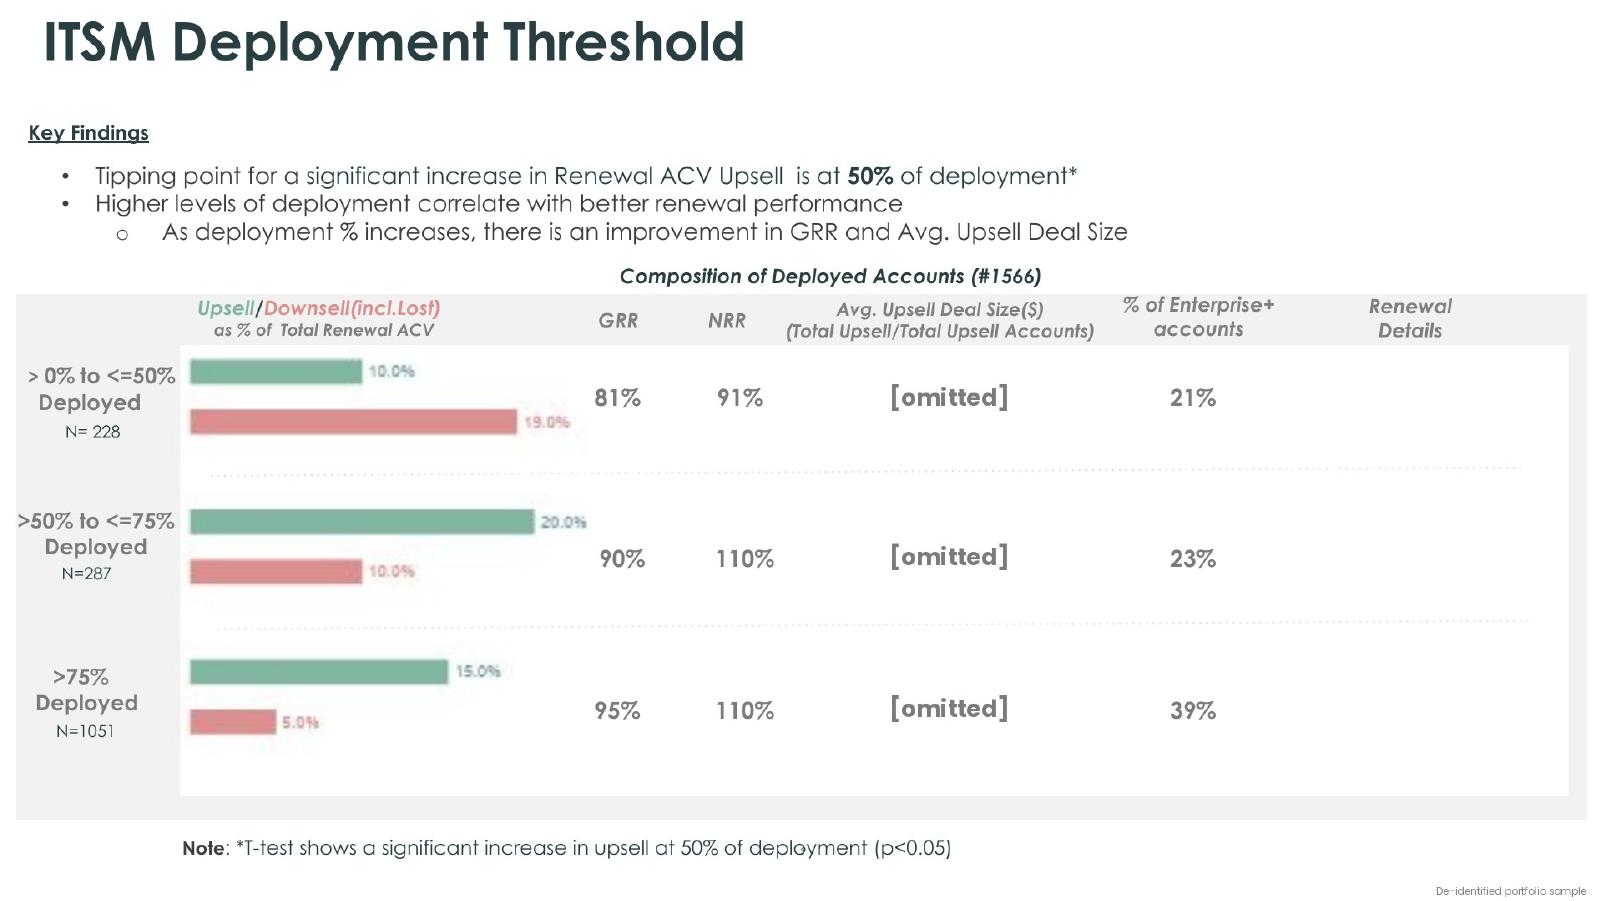
- ›Beyond 50% of apps deployed, renewal performance improves significantly (t-test, p < 0.05)
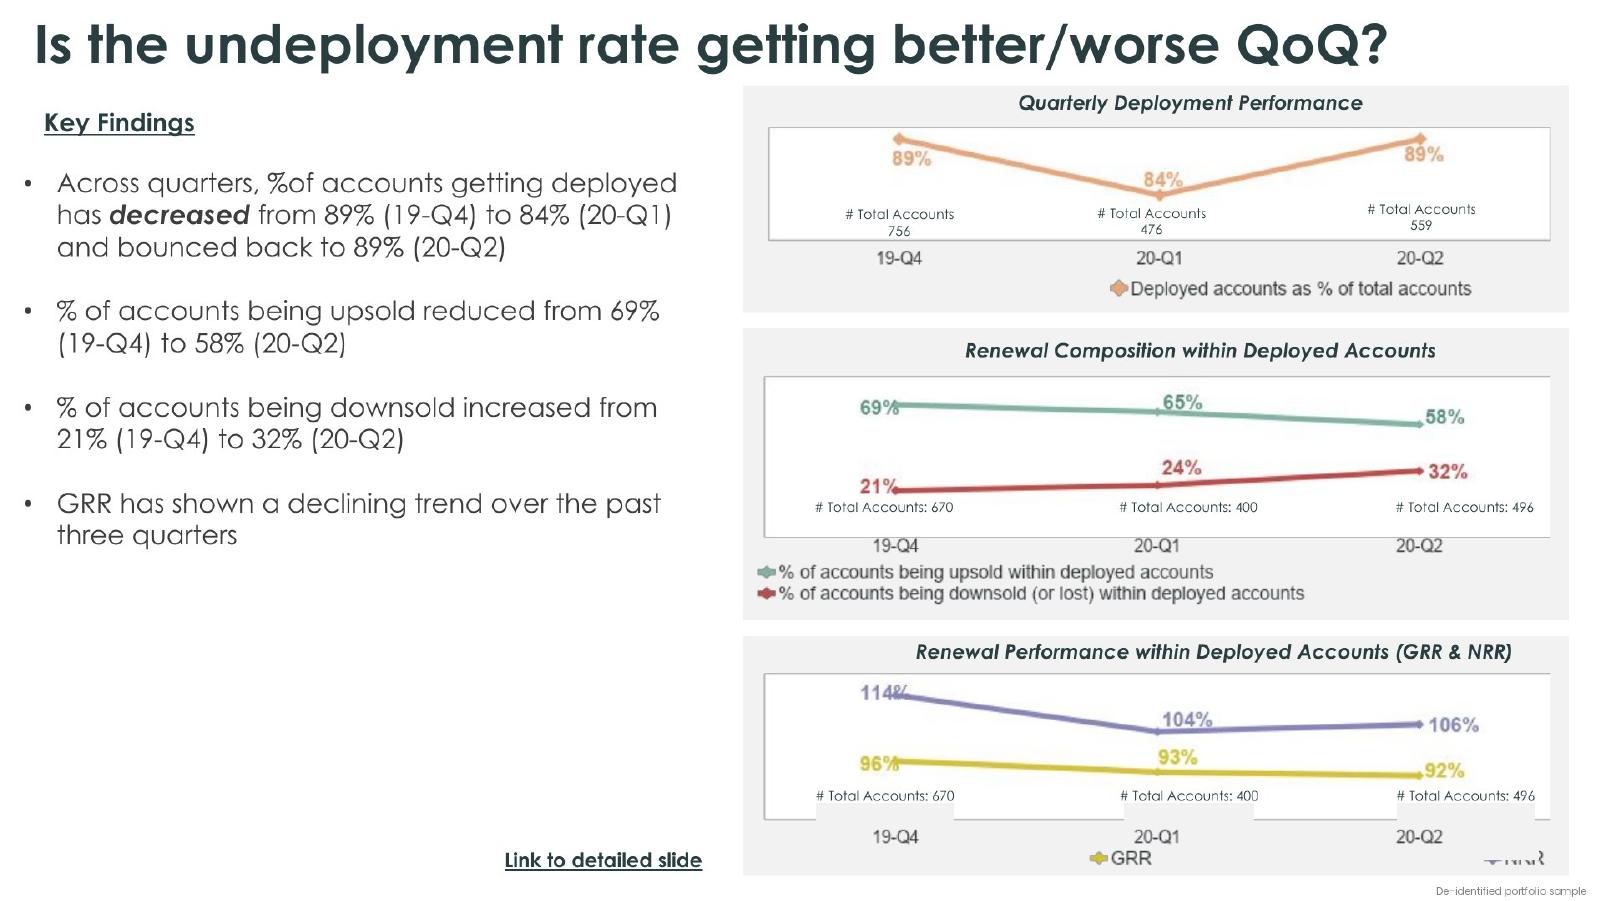
- ›Within deployed accounts, GRR declined over three quarters: 96% → 93% → 92%
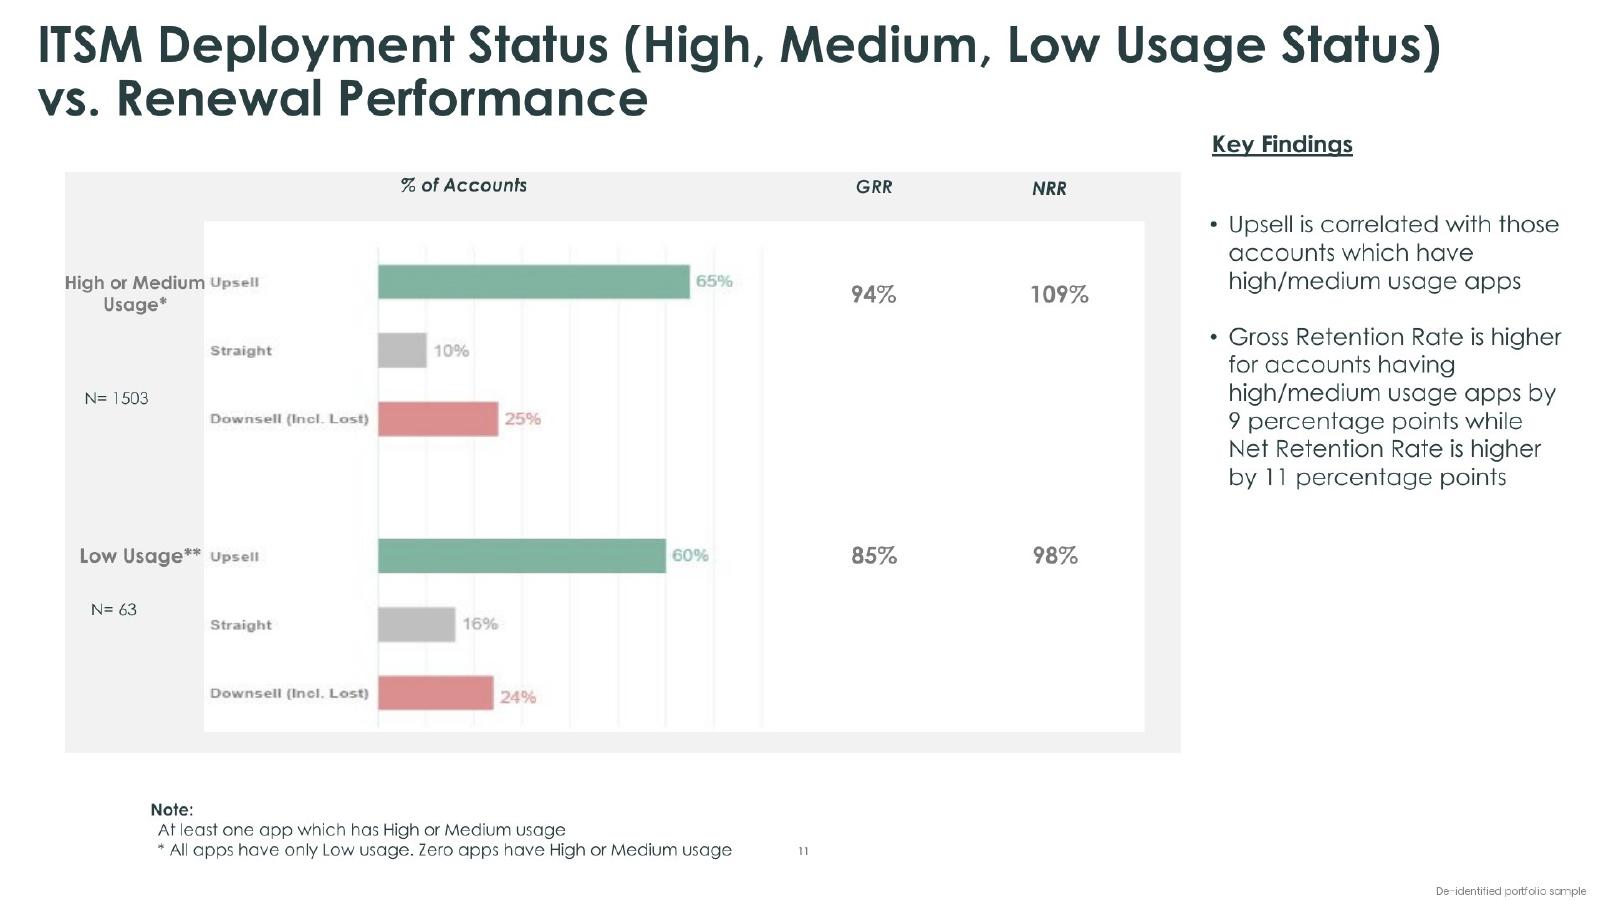
- ›Depth of usage (High/Medium vs. Low) is also positively correlated with renewal performance
## ITSM Core - landscape & threshold analysis
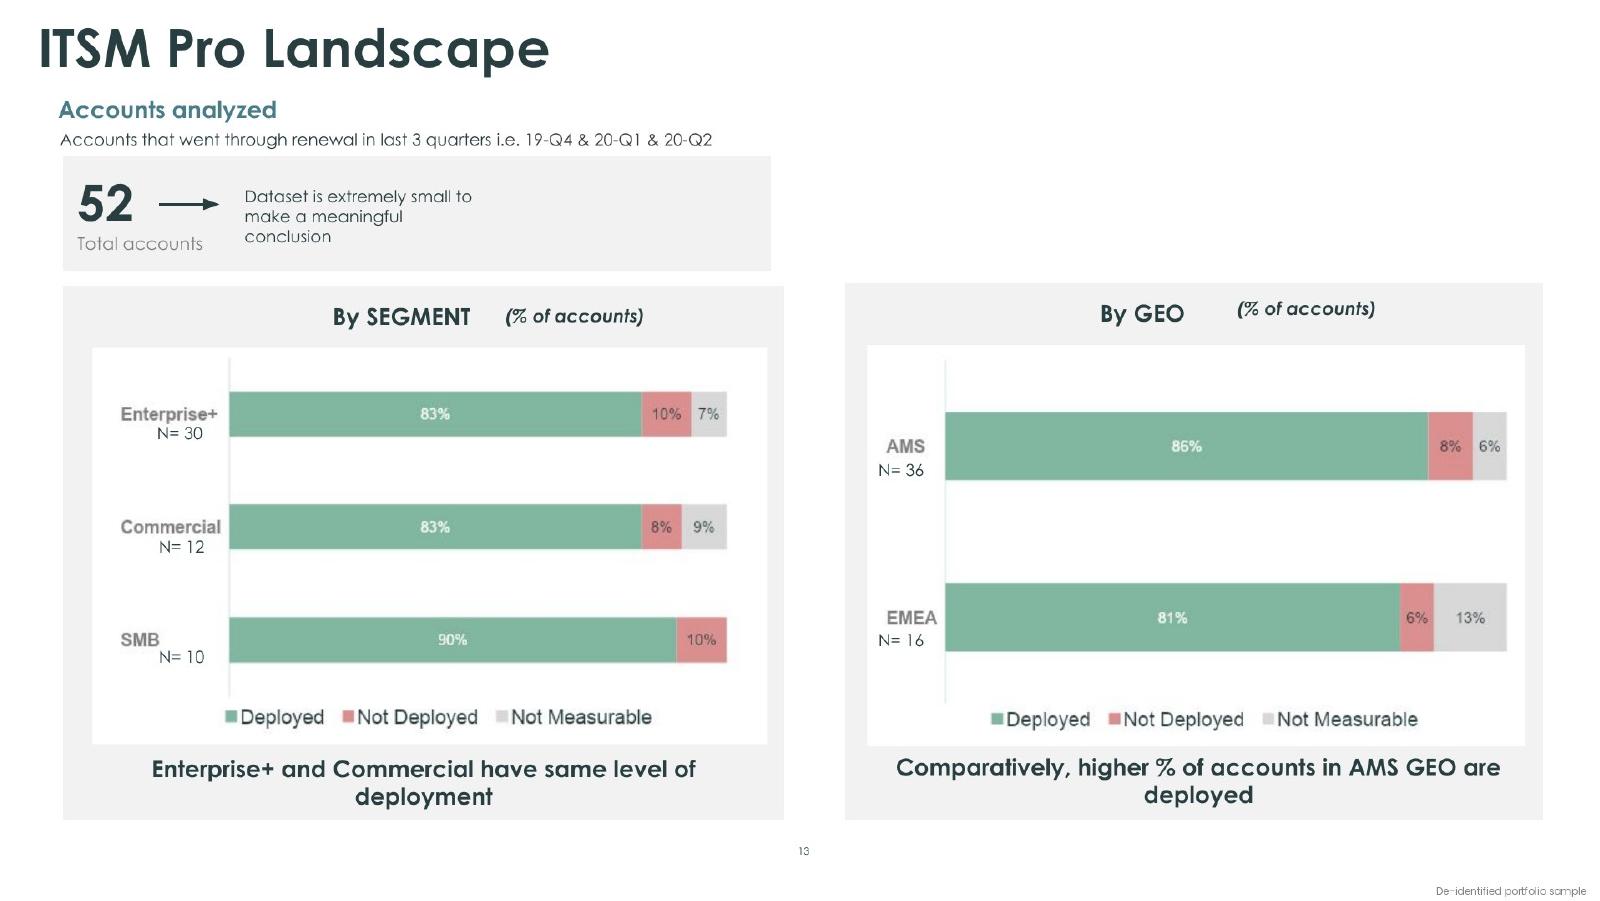
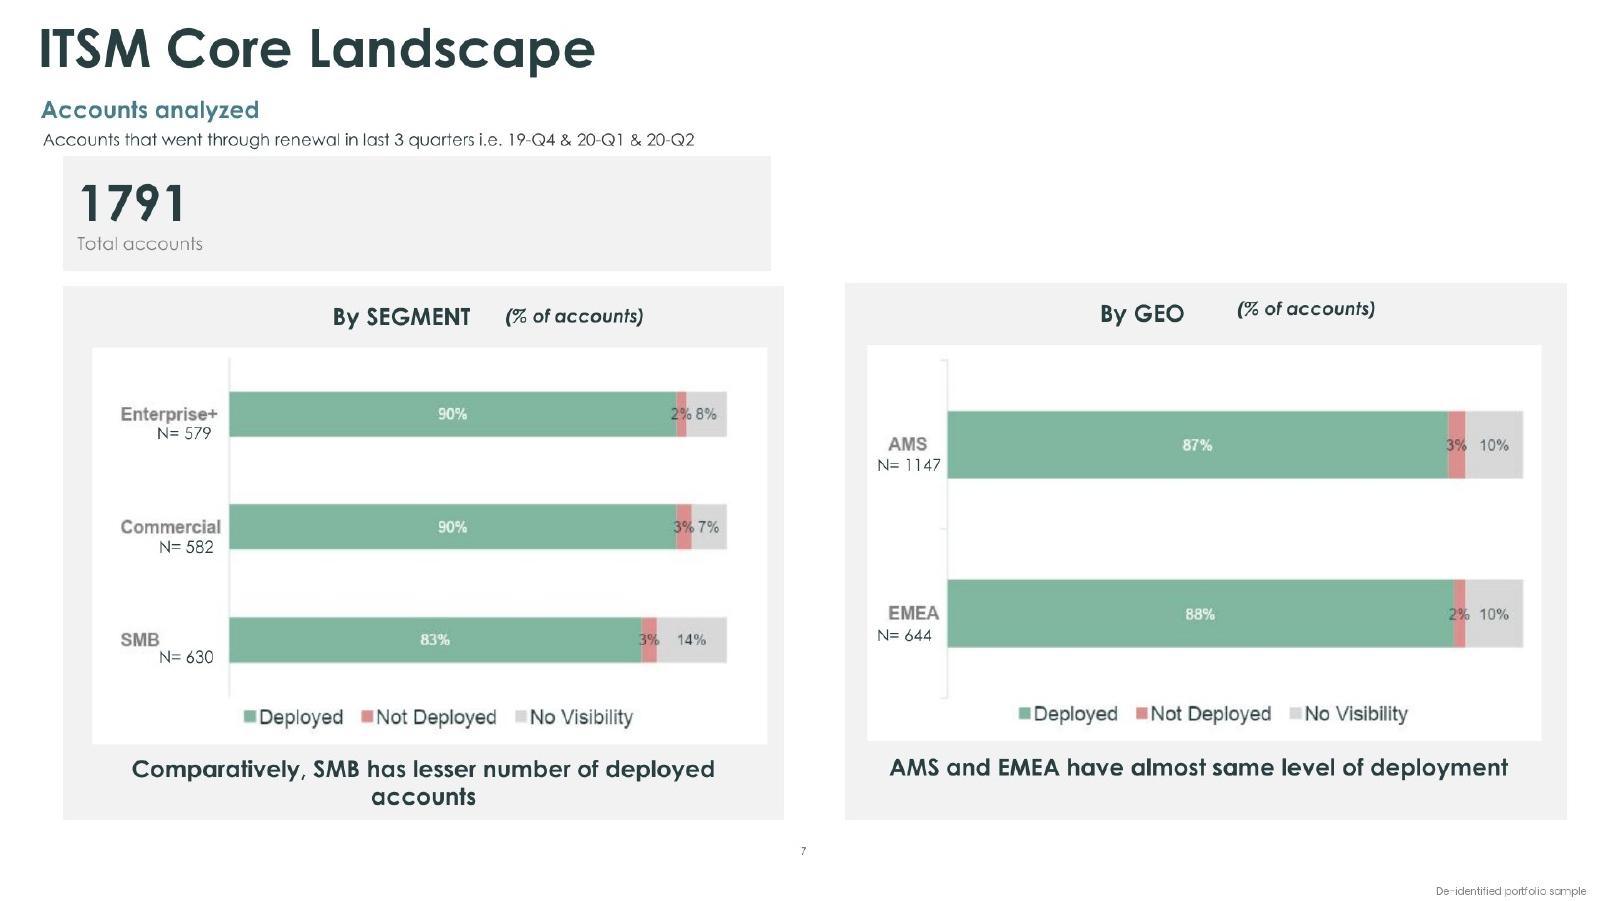
- ›1,791 accounts; 87% of core accounts deployed
- ›SMB has fewer deployed accounts; AMS and EMEA deploy at similar levels
- ›GRR is 24 points and NRR 29 points higher for deployed accounts
- ›>0–50% deployed: 81% GRR / 91% NRR; >50–75%: 90% / 110%; >75–100%: 95% / 110% and the highest share of Enterprise+ accounts
- ›Quarterly: deployed share 89% → 84% → 89%; upsold share fell 69% → 58%, downsold rose 21% → 32%
- ›High/Medium-usage accounts beat low-usage-only accounts by 9 points GRR and 11 points NRR
## ITSM Pro
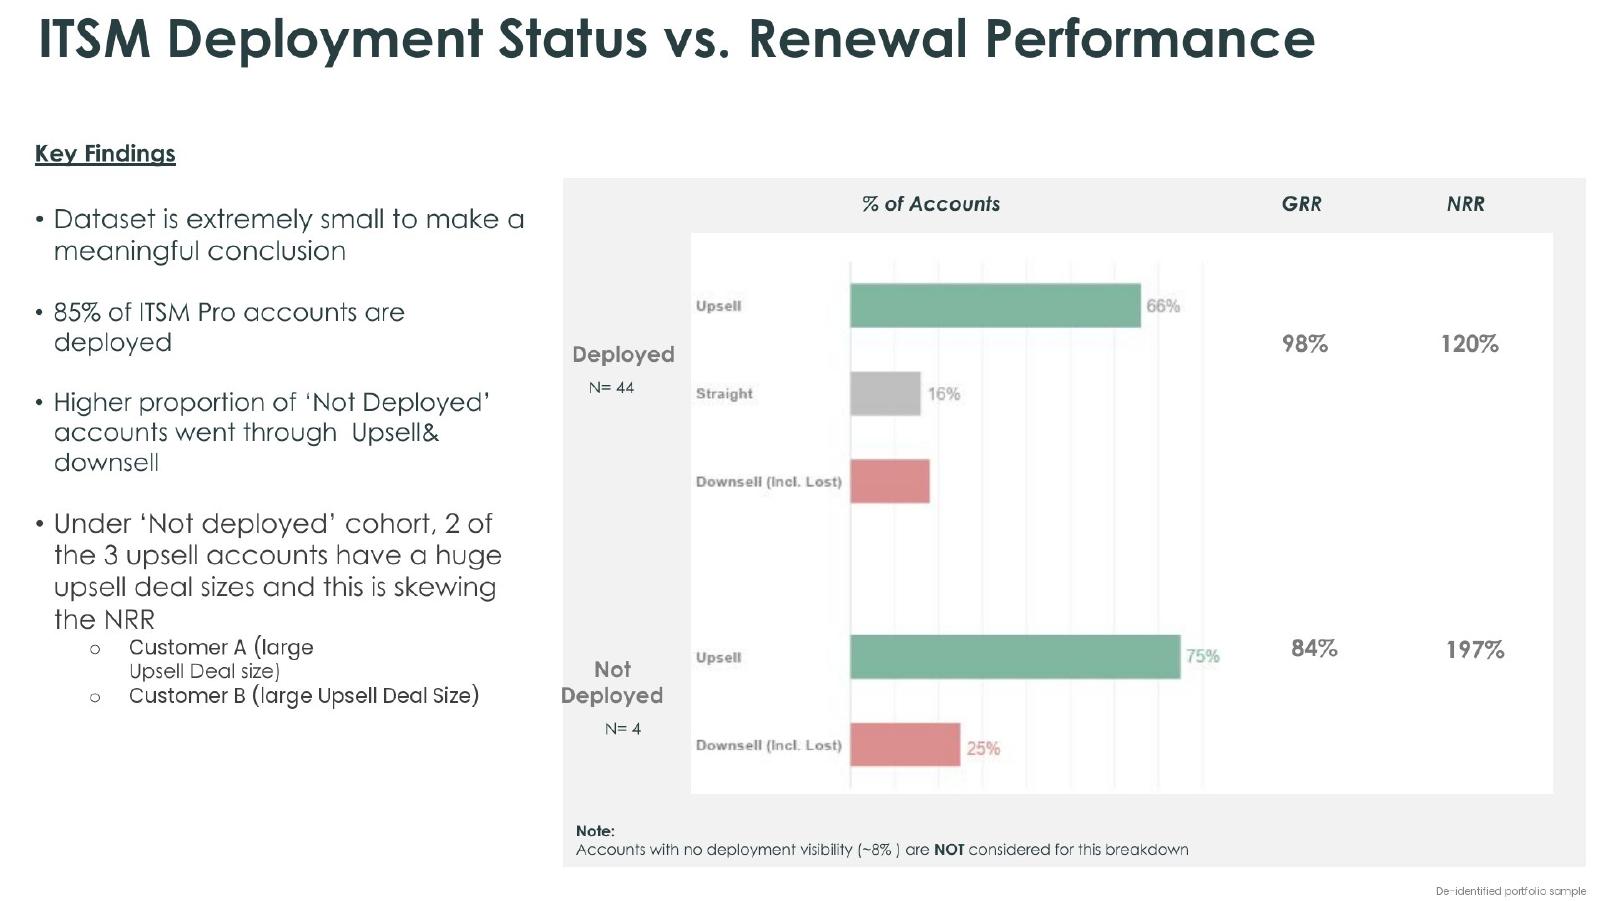
52 accounts - too small for a meaningful conclusion. 85% deployed (98% GRR / 120% NRR); the not-deployed NRR (197%) is skewed by two very large upsell deals.
## Sentiment analysis
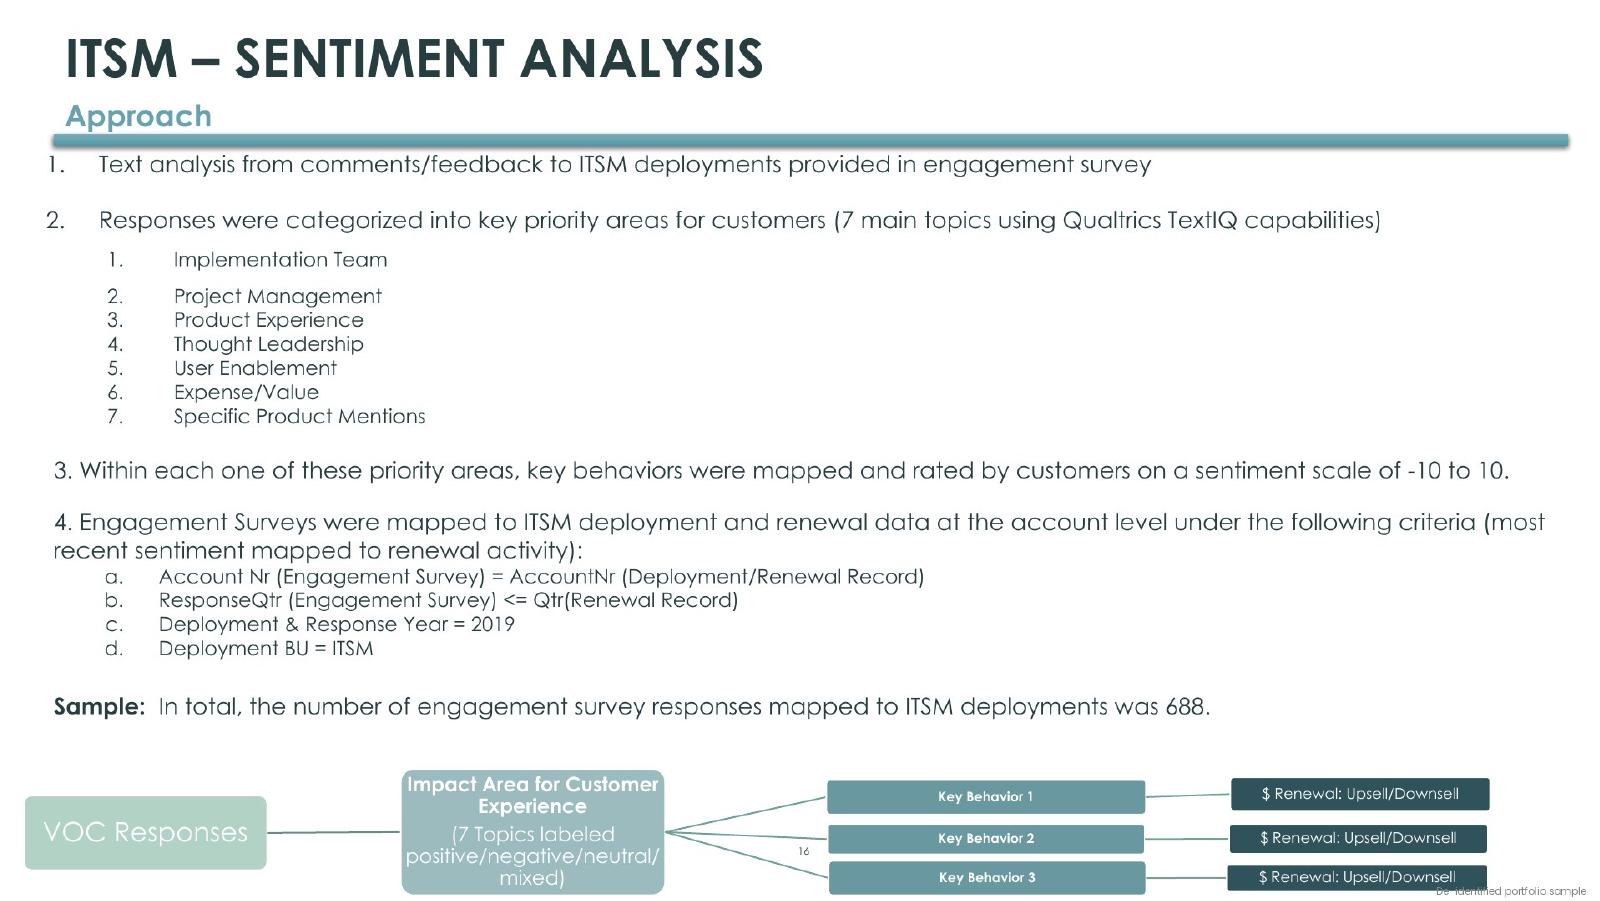
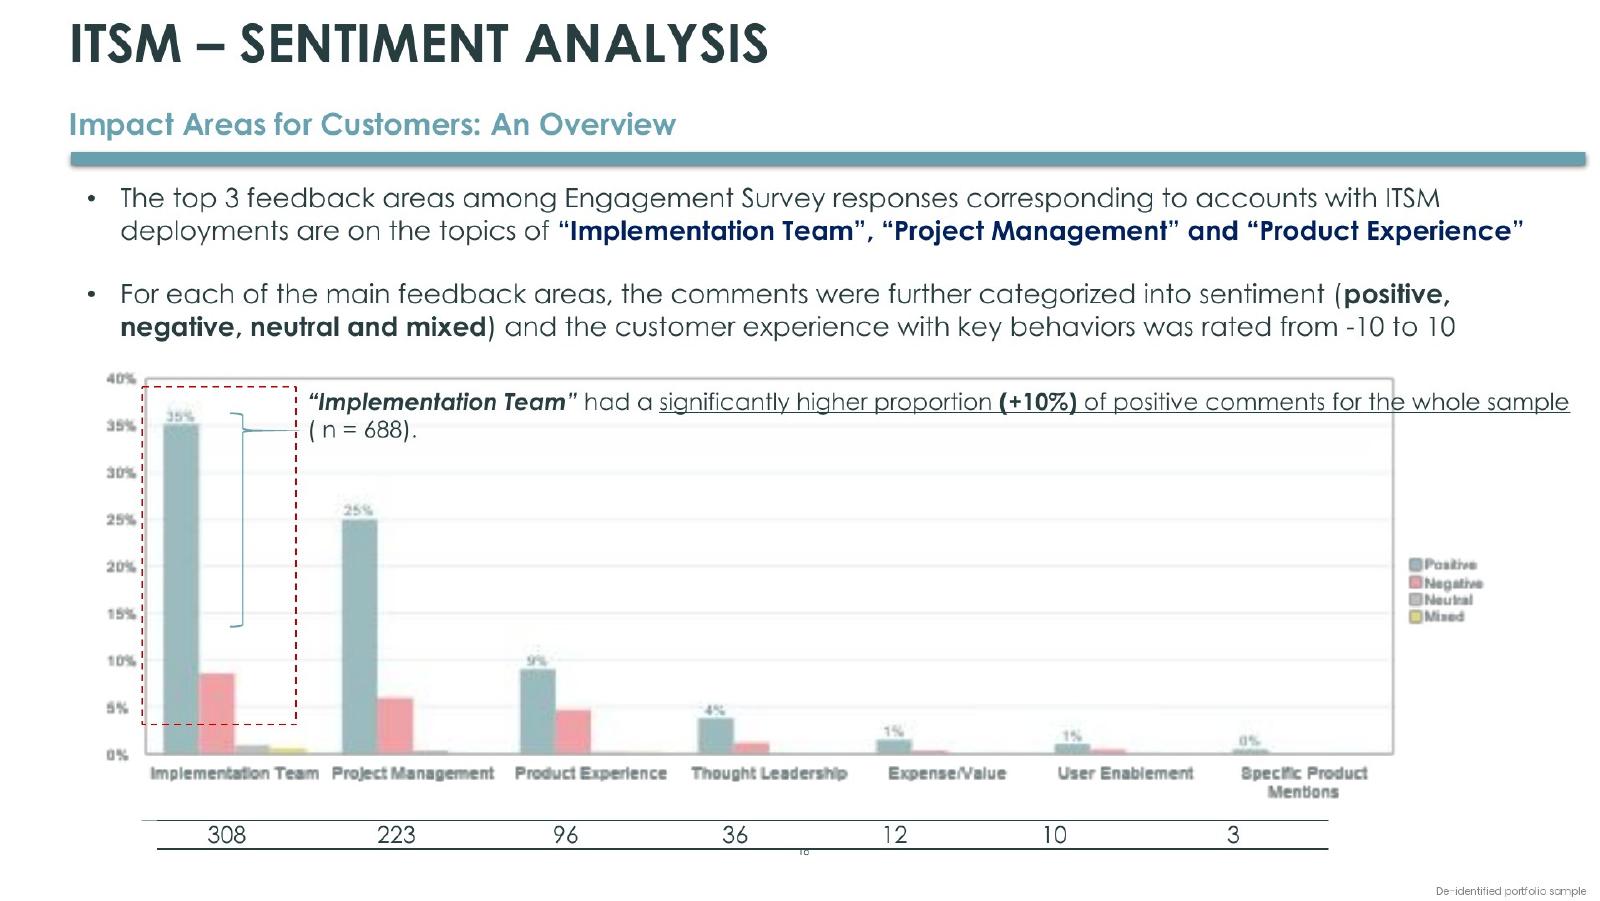
- ›688 engagement-survey responses mapped to ITSM deployments and renewals (most recent sentiment before renewal)
- ›Comments grouped into 7 topics with Qualtrics TextIQ and rated on a −10 to 10 sentiment scale
- ›Top areas: Implementation Team (308), Project Management (223), Product Experience (96)
- ›Implementation Team shows a significantly higher (+10%) share of positive comments
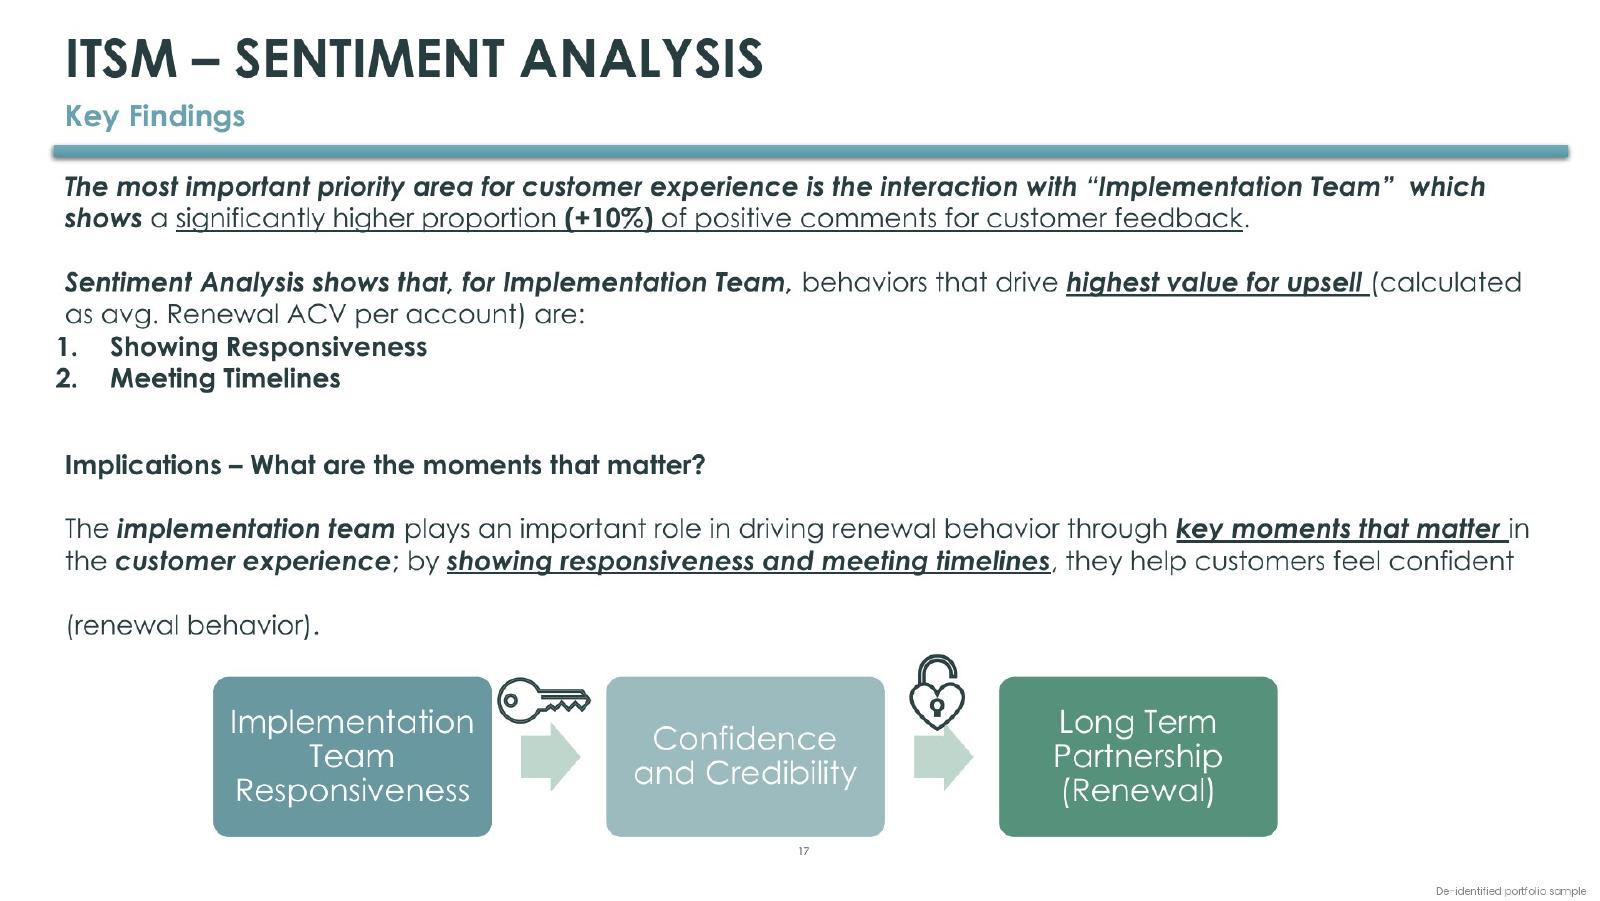
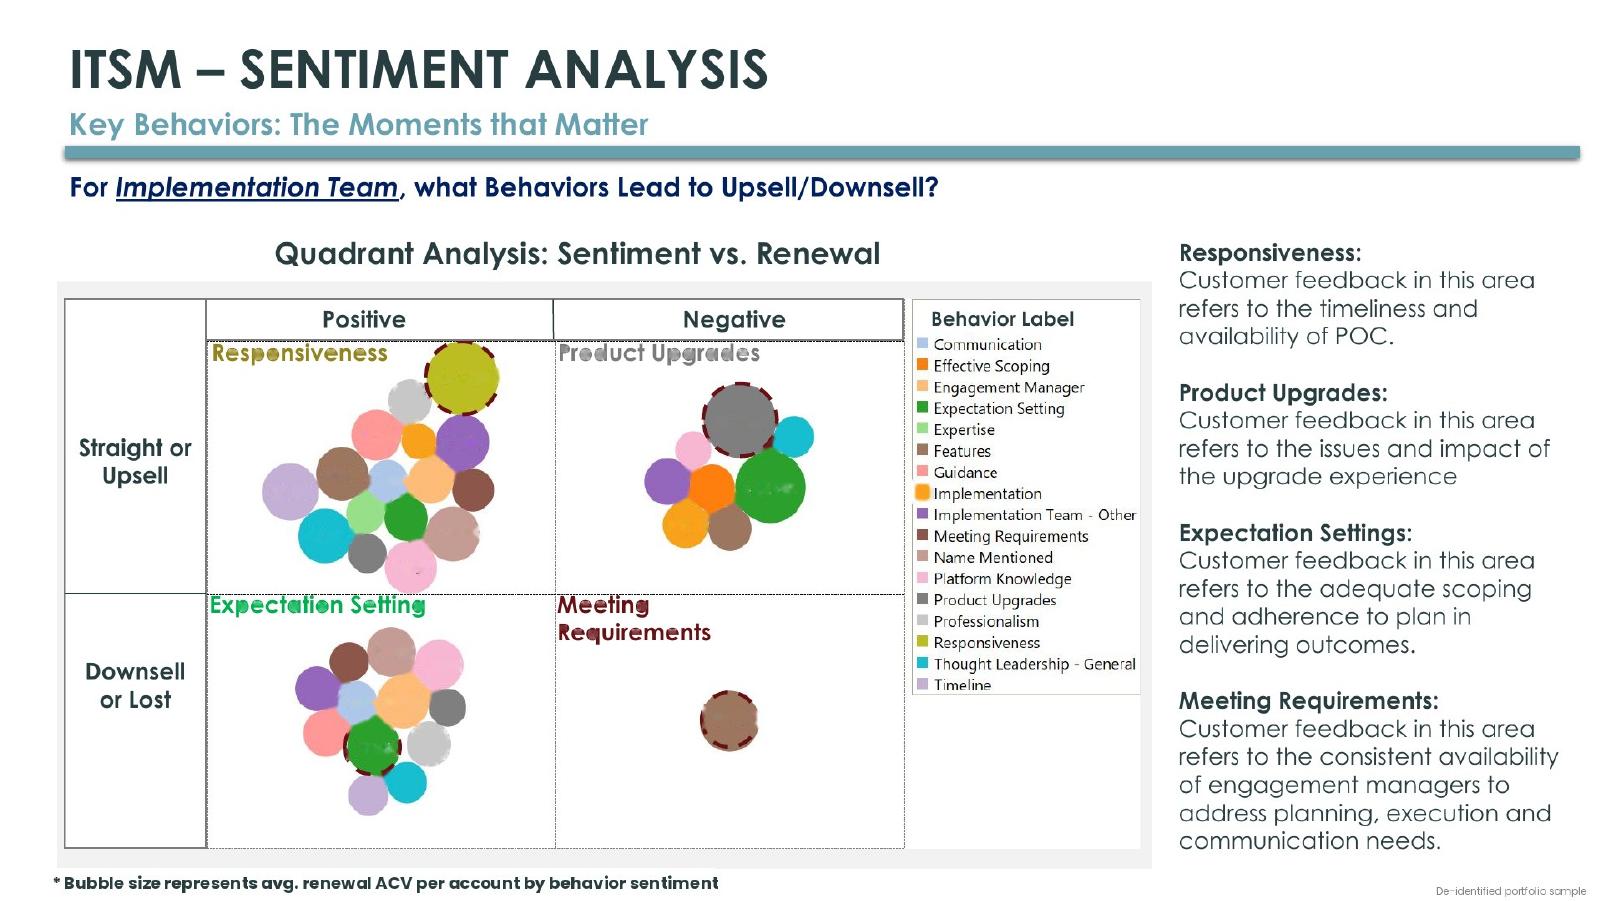
- ›Behaviors driving the most value: Responsiveness and Meeting Timelines
- ›Highest cost: Meeting Requirements (highest avg. downsell per account)
- ›Moments that matter: responsiveness → trust → renewal
## Regression analysis
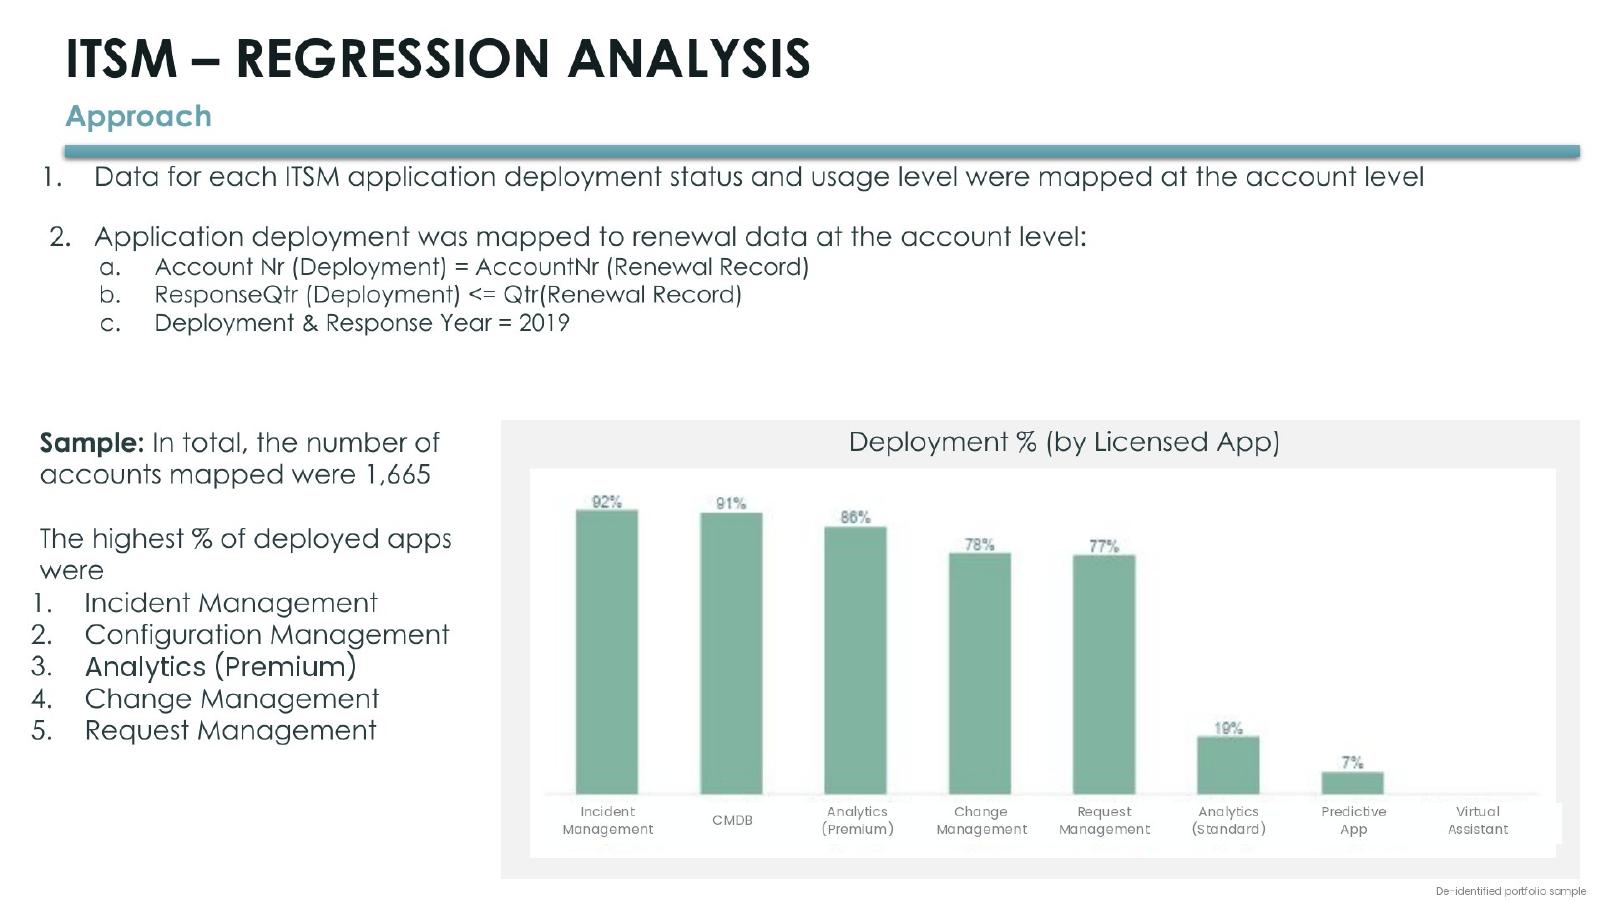
- ›1,665 accounts with app deployment and usage mapped to renewal data
- ›Most deployed apps: Incident, Configuration, Analytics (Premium), Change, Request Management
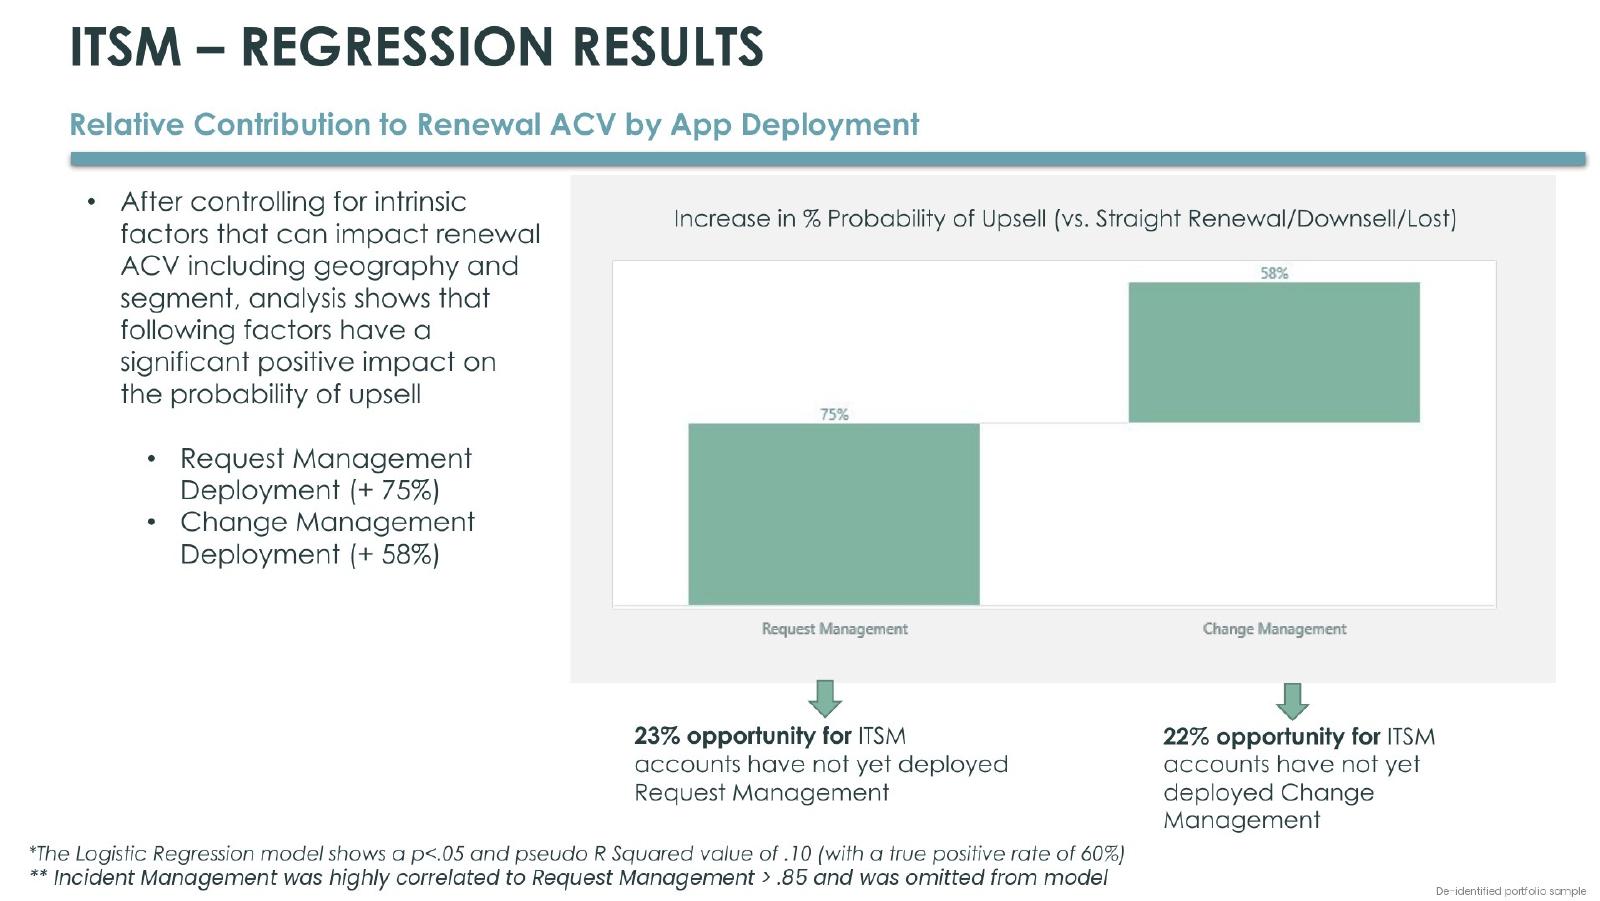
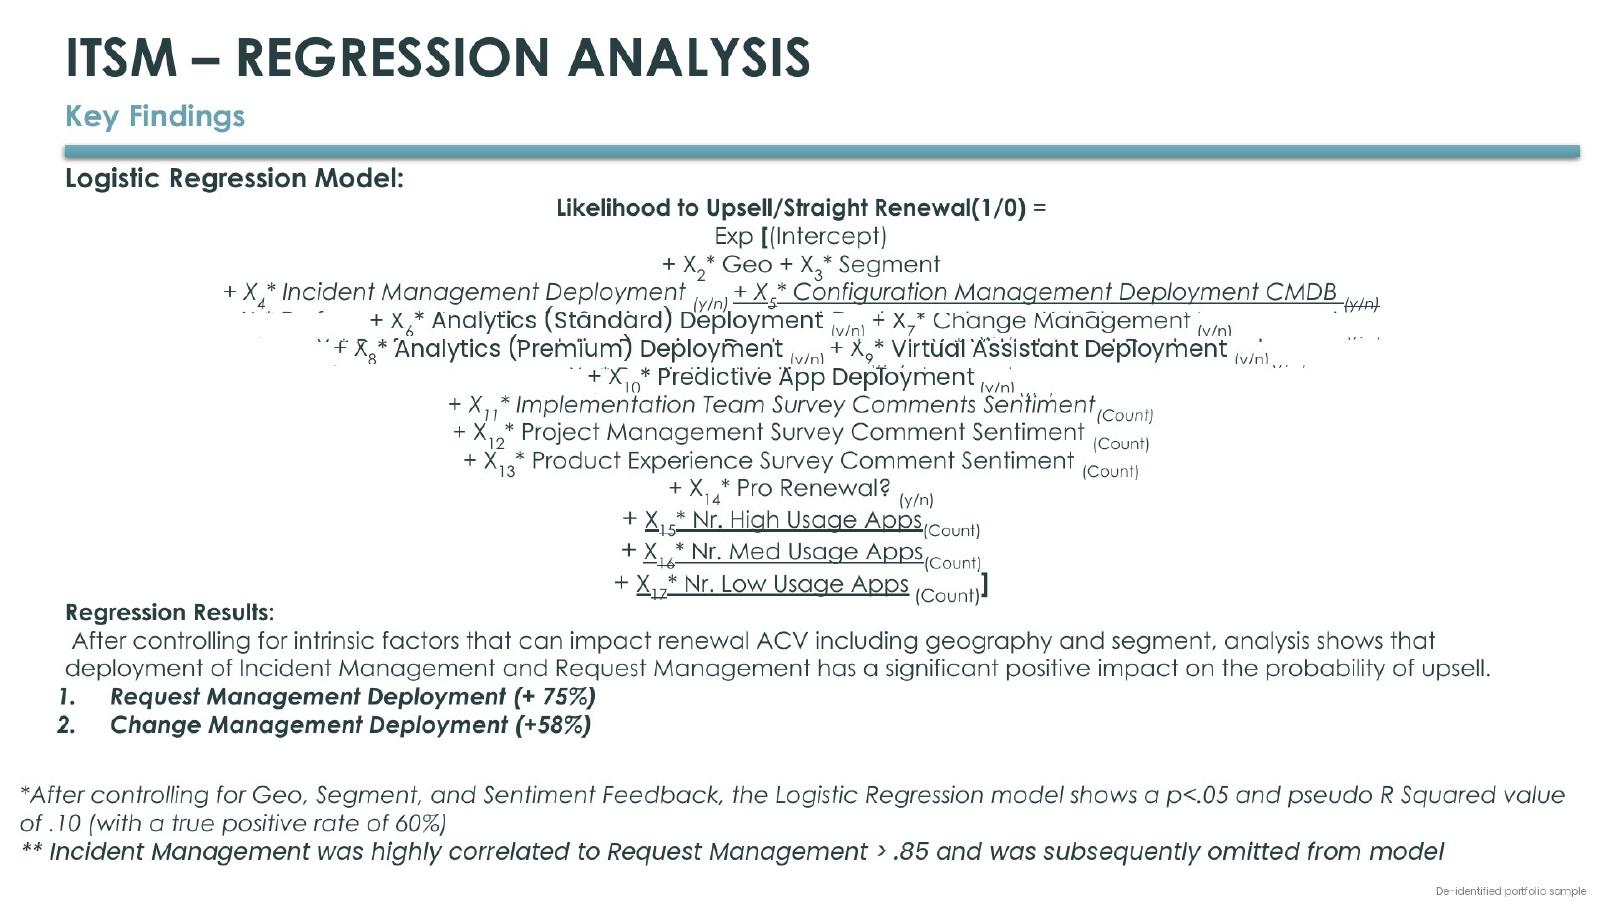
- ›Logistic regression controlling for geography and segment (p < .05, pseudo R² = .10)
- ›Request Management deployment raises upsell probability by 75%; Change Management by 58%
- ›Opportunity: 23% of accounts haven't deployed Request Management, 22% haven't deployed Change Management
- ›Incident Management was omitted (correlated > .85 with Request Management)
- year
- 2020
- status
- Analysis (employer work, de-identified)
- tags
- Customer analyticsLogistic regression
show all 27 slides