#12 · 2023
ROI Generated by Lottery Advertising
AnalysisPublic policy · OLS time-series regression · OPPAGA Report No. 14-06
my_role: Individual Contributor (IC) - built the OLS time-series model estimating returns to the education trust fund.
Estimating lottery advertising returns to Florida’s Educational Enhancement Trust Fund.
## Method used to estimate the return to education
OPPAGA Report No. 14-06, Appendix D. To estimate transfers to the Educational Enhancement Trust Fund generated by Lottery advertising, we used ordinary least squares time series regression. This statistical method uses the correlation between the timing of lottery sales and media expenditures to estimate the return in sales for $1.00 spent in media expenditures, which can be converted to estimate the impact of $1.00 in advertising expenditures on transfers to the Florida Educational Enhancement Trust Fund.
## Data
The Department of the Lottery provided sales data for the 84-month period between July 2006 and June 2013, and advertising expenditure data for the period March 2006 through June 2013. We used these slightly different time periods because sales tend to slightly lag advertising expenditures; prior research on lottery advertising concluded that advertising spending affects sales in the month that the expenditure was made as well as subsequent months. The department also provided data on lottery retailers and advertised jackpots. The University of Florida’s Bureau of Economic and Business Research provided county-level data on population and taxable sales, and we obtained county-level unemployment information from the U.S. Bureau of Labor Statistics.
## Methods of analysis
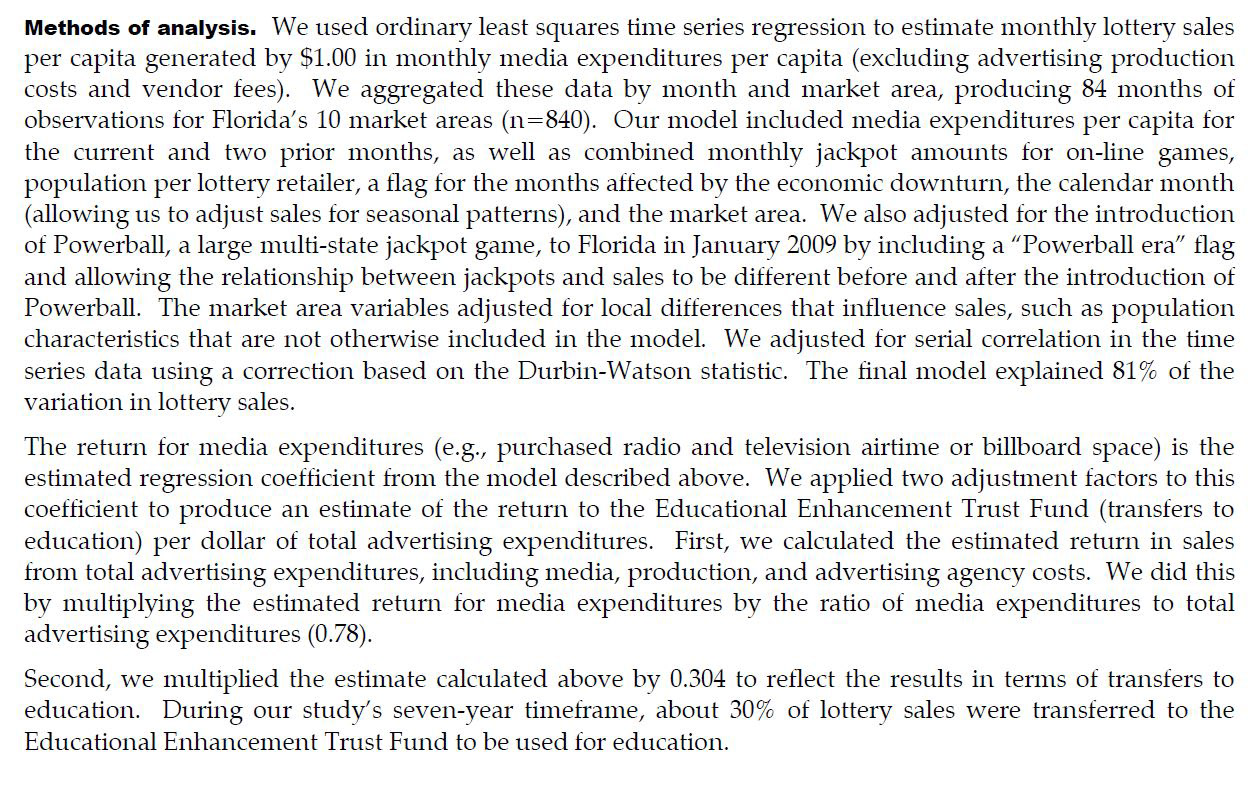
We used ordinary least squares time series regression to estimate monthly lottery sales per capita generated by $1.00 in monthly media expenditures per capita (excluding advertising production costs and vendor fees). We aggregated these data by month and market area, producing 84 months of observations for Florida’s 10 market areas (n = 840). Our model included media expenditures per capita for the current and two prior months, as well as combined monthly jackpot amounts for on-line games, population per lottery retailer, a flag for the months affected by the economic downturn, the calendar month (allowing us to adjust sales for seasonal patterns), and the market area. We also adjusted for the introduction of Powerball, a large multi-state jackpot game, to Florida in January 2009 by including a Powerball era flag and allowing the relationship between jackpots and sales to be different before and after the introduction of Powerball. The market area variables adjusted for local differences that influence sales, such as population characteristics that are not otherwise included in the model. We adjusted for serial correlation in the time series data using a correction based on the Durbin-Watson statistic. The final model explained 81% of the variation in lottery sales.
## Converting media returns to education transfers
The return for media expenditures (e.g., purchased radio and television airtime or billboard space) is the estimated regression coefficient from the model described above. We applied two adjustment factors to this coefficient to produce an estimate of the return to the Educational Enhancement Trust Fund (transfers to education) per dollar of total advertising expenditures.
- ›First, we calculated the estimated return in sales from total advertising expenditures, including media, production and advertising agency costs. We multiplied the estimated return for media expenditures by the ratio of media expenditures to total advertising expenditures (0.78).
- ›Second, we multiplied the estimate calculated above by 0.304 to reflect the results in terms of transfers to education. During our study’s seven-year timeframe, about 30% of lottery sales were transferred to the Educational Enhancement Trust Fund to be used for education.
## Statistical results
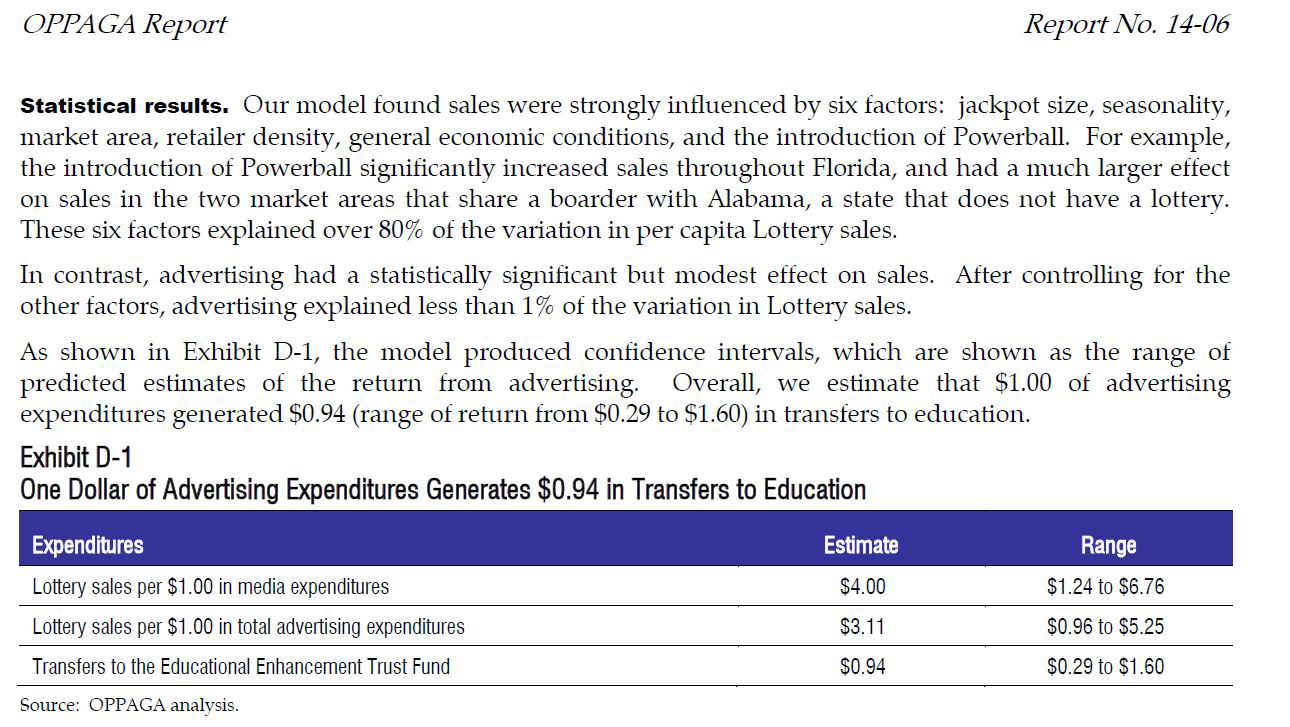
Our model found sales were strongly influenced by six factors: jackpot size, seasonality, market area, retailer density, general economic conditions and the introduction of Powerball. For example, the introduction of Powerball significantly increased sales throughout Florida, and had a much larger effect on sales in the two market areas that share a border with Alabama, a state that does not have a lottery. These six factors explained over 80% of the variation in per capita Lottery sales. In contrast, advertising had a statistically significant but modest effect on sales. After controlling for the other factors, advertising explained less than 1% of the variation in Lottery sales.
## Exhibit D-1 - estimated return per dollar
The model produced confidence intervals, shown as the range of predicted estimates of the return from advertising. Overall, we estimate that $1.00 of advertising expenditures generated $0.94 (range of return from $0.29 to $1.60) in transfers to education. Source: OPPAGA analysis.
- ›Lottery sales per $1.00 in media expenditures: $4.00; range $1.24–$6.76
- ›Lottery sales per $1.00 in total advertising expenditures: $3.11; range $0.96–$5.25
- ›Transfers to the Educational Enhancement Trust Fund: $0.94; range $0.29–$1.60
## Additional analysis - production costs and recent periods
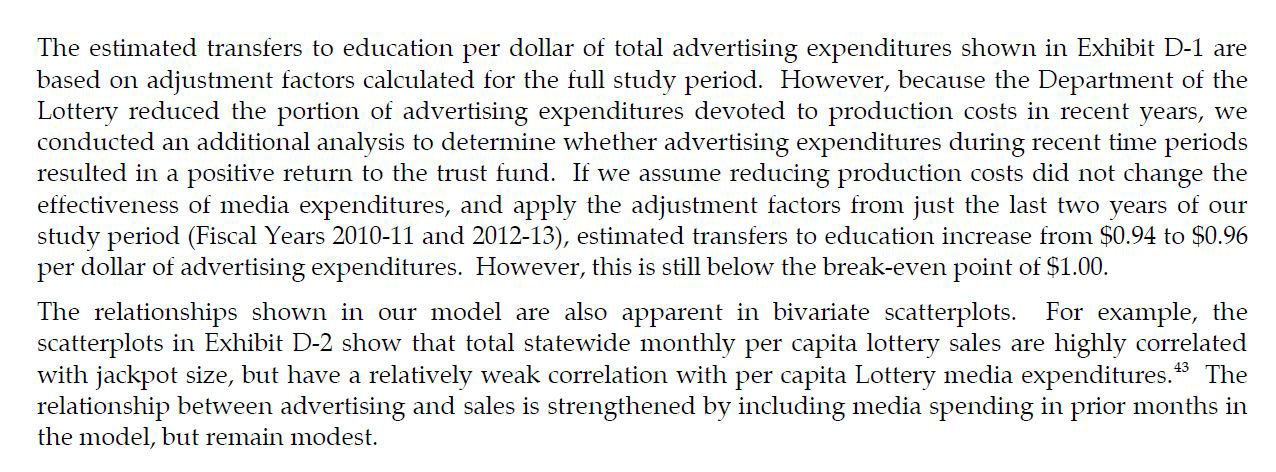
The estimated transfers to education per dollar of total advertising expenditures shown in Exhibit D-1 are based on adjustment factors calculated for the full study period. However, because the Department of the Lottery reduced the portion of advertising expenditures devoted to production costs in recent years, we conducted an additional analysis to determine whether advertising expenditures during recent time periods resulted in a positive return to the trust fund. If we assume reducing production costs did not change the effectiveness of media expenditures, and apply the adjustment factors from just the last two years of our study period (Fiscal Years 2010–11 and 2012–13, as stated in the original report excerpt), estimated transfers to education increase from $0.94 to $0.96 per dollar of advertising expenditures. However, this is still below the break-even point of $1.00.
## Bivariate relationships
The relationships shown in our model are also apparent in bivariate scatterplots. For example, the scatterplots in Exhibit D-2 show that total statewide monthly per capita lottery sales are highly correlated with jackpot size, but have a relatively weak correlation with per capita Lottery media expenditures. The relationship between advertising and sales is strengthened by including media spending in prior months in the model, but remains modest.
- year
- 2023
- status
- Analysis
- tags
- Time-series regressionPublic policy