#07 · 2023
ASAT Drivers Analysis for Electronics Products
AnalysisCustomer analytics · Correlation analysis · ANOVA
my_role: Individual Contributor (IC) - ran the correlation and ANOVA analyses and turned them into recommendations for support teams.
Evaluating agent satisfaction, helpfulness, and warranty support across customer segments.
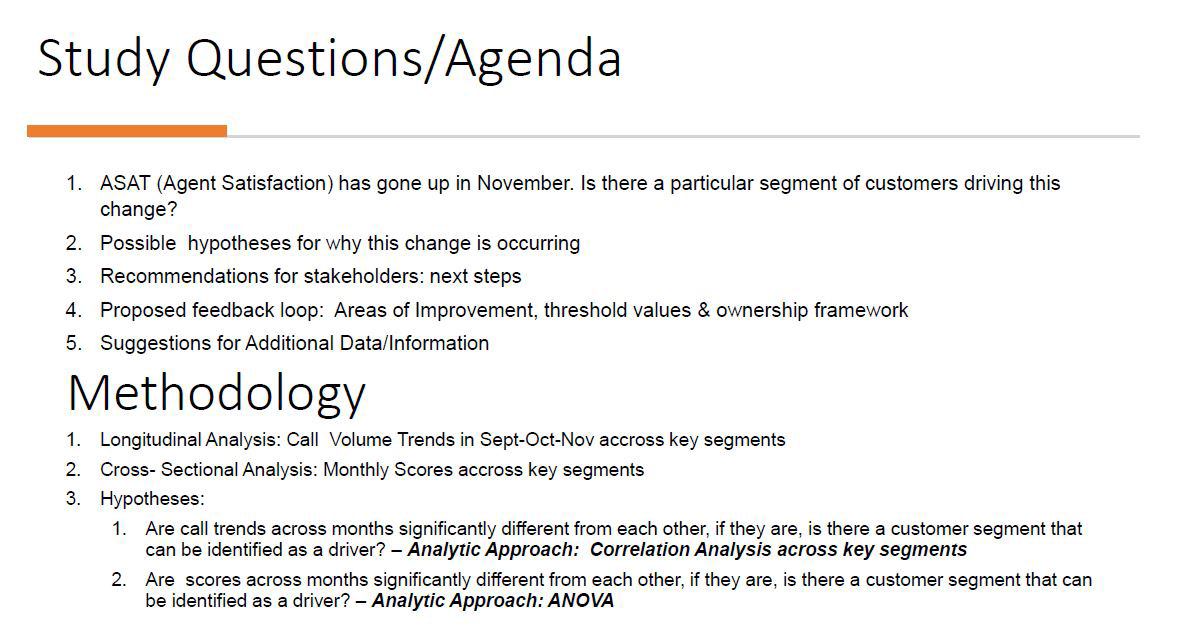
## Study questions
- ›ASAT (Agent Satisfaction) has gone up in November. Is there a particular segment of customers driving this change?
- ›Possible hypotheses for why this change is occurring
- ›Recommendations for stakeholders: next steps
- ›Proposed feedback loop: areas of improvement, threshold values and ownership framework
- ›Suggestions for additional data/information
## Methodology
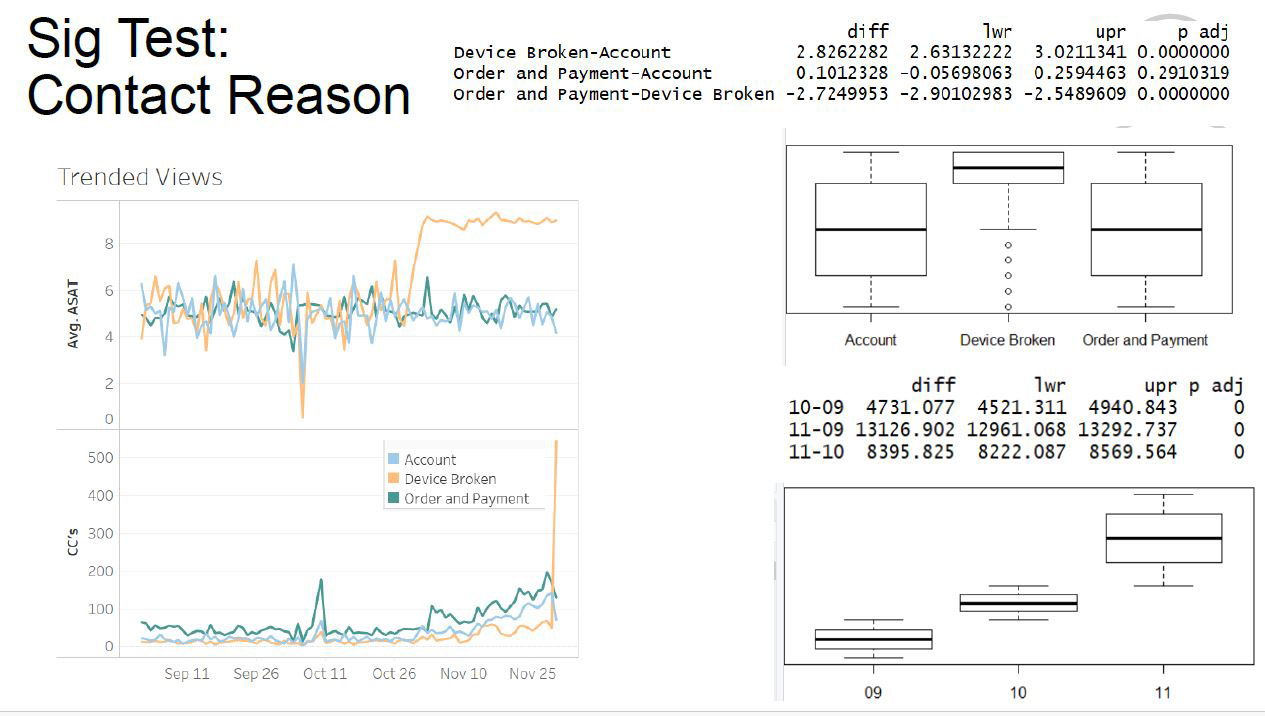
- ›Longitudinal analysis: call volume trends in September–October–November across key segments
- ›Cross-sectional analysis: monthly scores across key segments
- ›Are call trends across months significantly different from each other? If so, can a customer segment be identified as a driver? Analytic approach: correlation analysis across key segments.
- ›Are scores across months significantly different from each other? If so, can a customer segment be identified as a driver? Analytic approach: ANOVA.
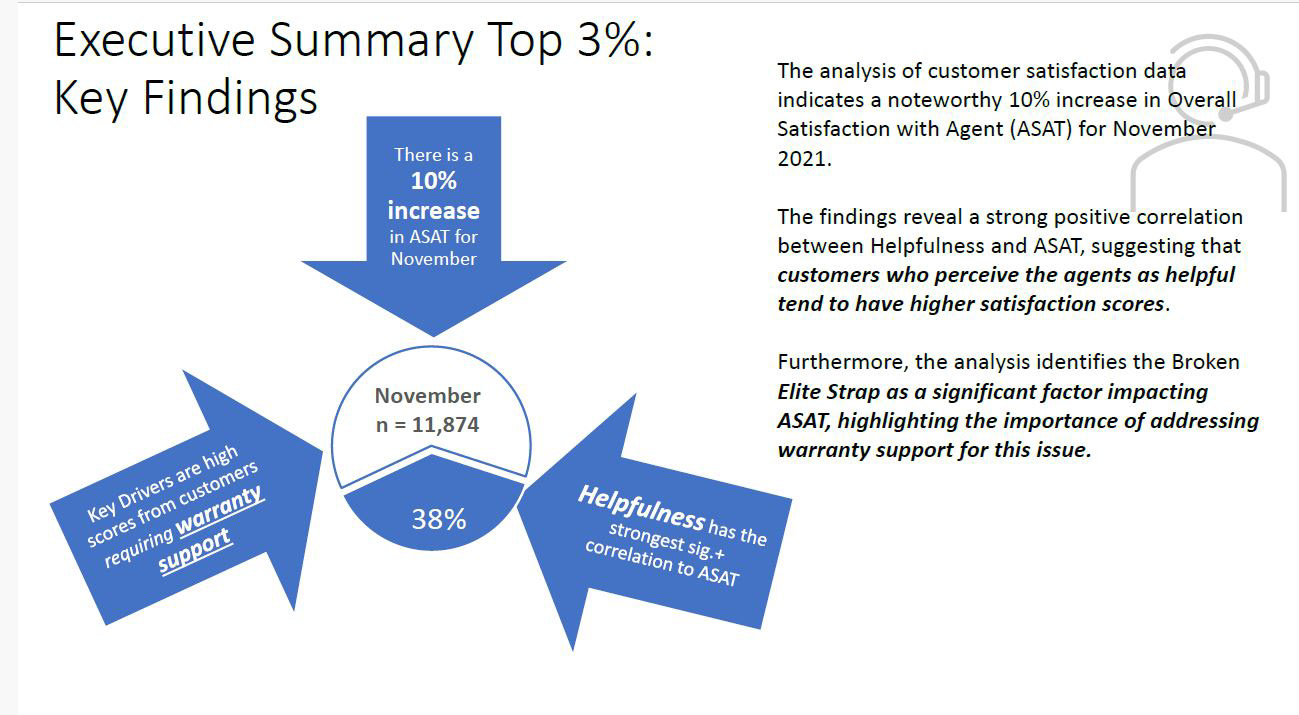
## Executive summary - top 3%
The analysis of customer satisfaction data indicates a noteworthy 10% increase in Overall Satisfaction with Agent (ASAT) for November 2021. The findings reveal a strong positive correlation between Helpfulness and ASAT, suggesting that customers who perceive the agents as helpful tend to have higher satisfaction scores. Furthermore, the analysis identifies the Broken Elite Strap as a significant factor impacting ASAT, highlighting the importance of addressing warranty support for this issue.
## Data overview
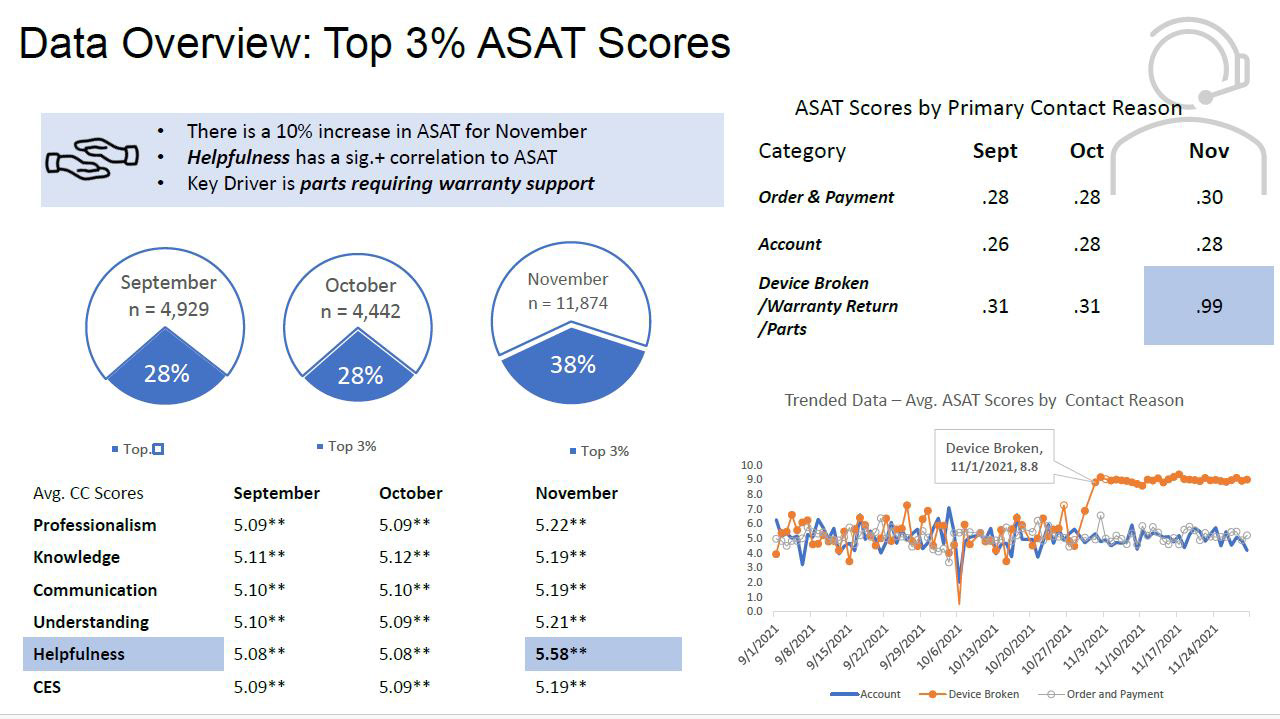
- ›September: n = 4,929; October: n = 4,442; November: n = 11,874
- ›Parts requiring warranty support are the key driver; the November summary highlights 38% for customers requiring warranty support.
- ›Contact-reason breakdown: Order and Payment, Account, and Device Broken / Warranty Return / Parts
- ›Customer-contact scores tracked: Professionalism, Knowledge, Communication, Understanding, Helpfulness and CES
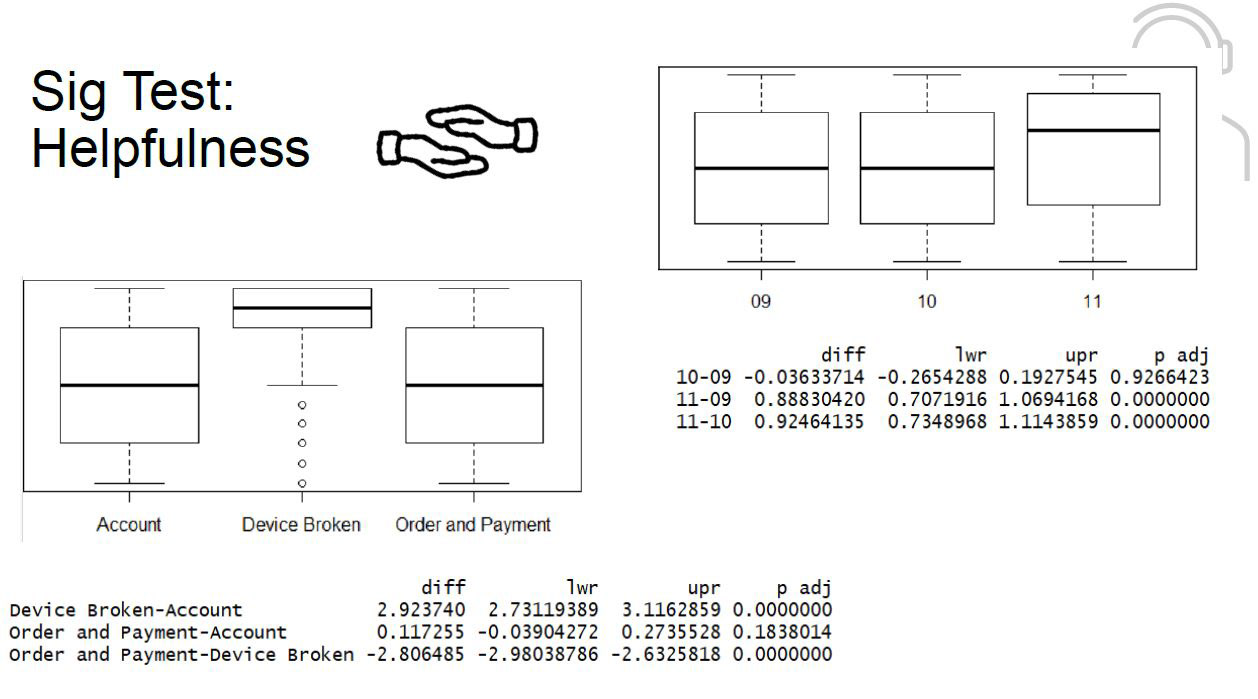
- ›Trended ASAT scores and significance tests compare contact reasons and months. Helpfulness tests show November differs significantly from both September and October; September versus October is not significant (adjusted p = 0.9266423).
- ›Helpfulness differences: November–September = 0.88830420; November–October = 0.92464135; both have adjusted p reported as 0.0000000. Full test tables and confidence intervals are retained in the figures below.
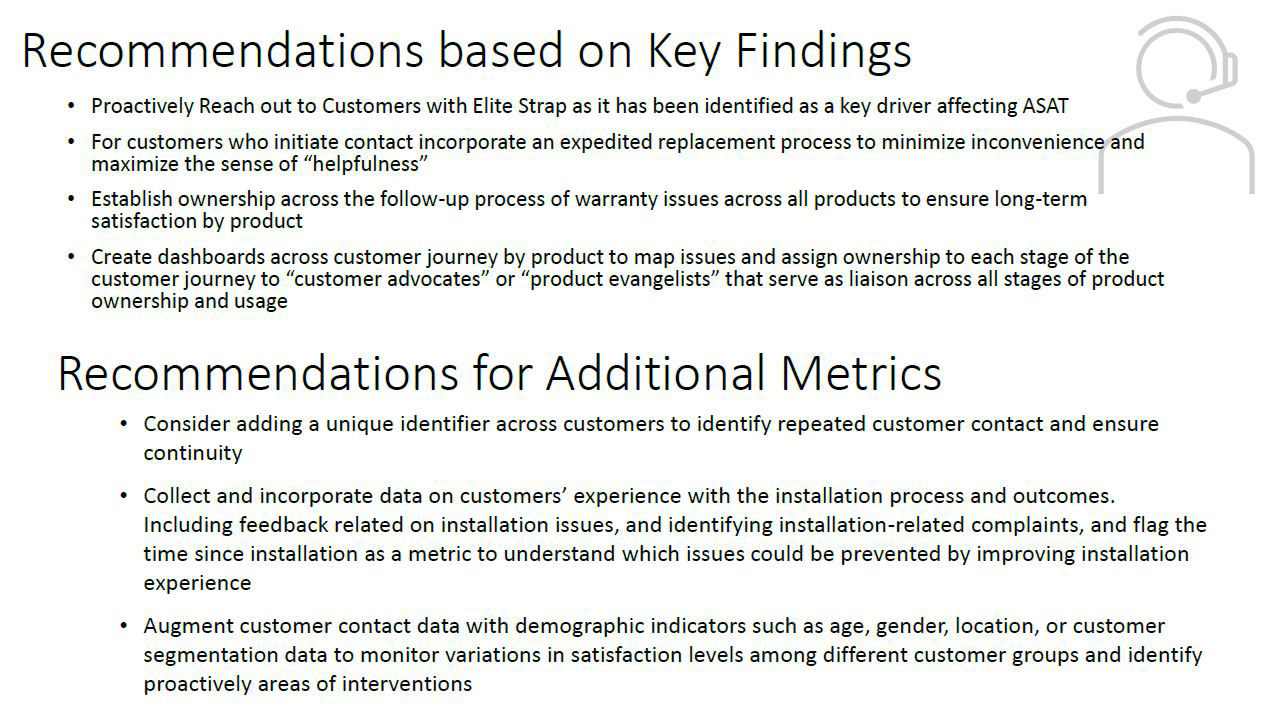
## Recommendations based on key findings
- ›Proactively reach out to customers with Elite Strap as it has been identified as a key driver affecting ASAT.
- ›For customers who initiate contact, incorporate an expedited replacement process to minimize inconvenience and maximize the sense of helpfulness.
- ›Establish ownership across the follow-up process of warranty issues across all products to ensure long-term satisfaction by product.
- ›Create dashboards across the customer journey by product to map issues and assign ownership to each stage, with customer advocates or product evangelists serving as liaisons across all stages of product ownership and usage.
## Recommendations for additional metrics
- ›Consider adding a unique identifier across customers to identify repeated customer contact and ensure continuity.
- ›Collect and incorporate data on customers’ experience with the installation process and outcomes: installation issues, complaints and time since installation, to understand which issues could be prevented by improving the installation experience.
- ›Augment customer contact data with demographic indicators such as age, gender, location or customer segmentation data to monitor variations in satisfaction levels and proactively identify areas for intervention.
- year
- 2023
- status
- Analysis
- tags
- Customer analyticsStatistical testing