#08 · 2023
Reviews and Productivity Analysis for Reported Posts
AnalysisTrust & safety · Quality assurance · Productivity analysis
my_role: Individual Contributor (IC) - measured review quality and productivity and proposed how to prioritize severe violations.
Analyzing reported posts, review quality, and productivity to prioritize severe violations.
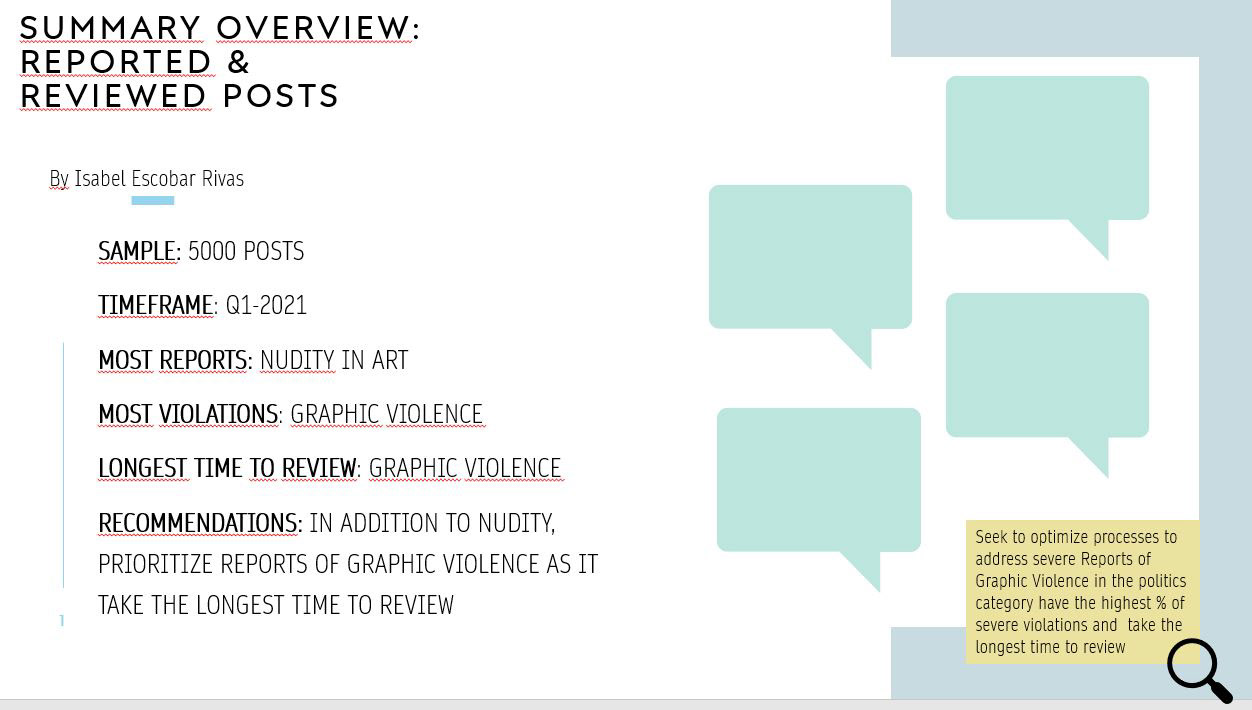
## Summary overview - reported and reviewed posts
Sample: 5,000 posts. Timeframe: Q1 2021 (January 1–March 31). Seek to optimize processes to address severe reports. Graphic Violence in the politics category has the highest percentage of severe violations and takes the longest time to review.
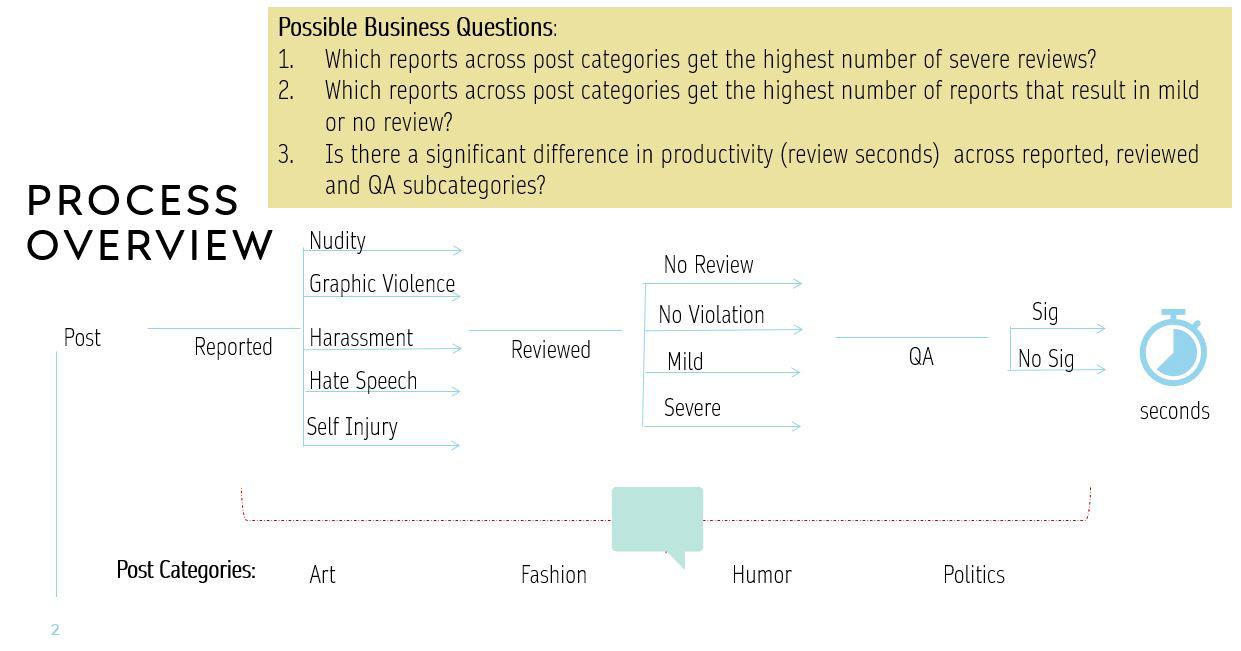
## Process overview and business questions
Posts are reported, reviewed and assessed by QA. Post categories are Art, Fashion, Humor and Politics; report reasons are Nudity, Graphic Violence, Harassment, Hate Speech and Self Injury. Review outcomes include No Violation, Mild, No Review and Severe. QA and review seconds are used to evaluate quality and productivity.
- ›Which reports across post categories get the highest number of severe reviews?
- ›Which reports across post categories get the highest number of reports that result in mild or no review?
- ›Is there a significant difference in productivity (review seconds) across reported, reviewed and QA subcategories?
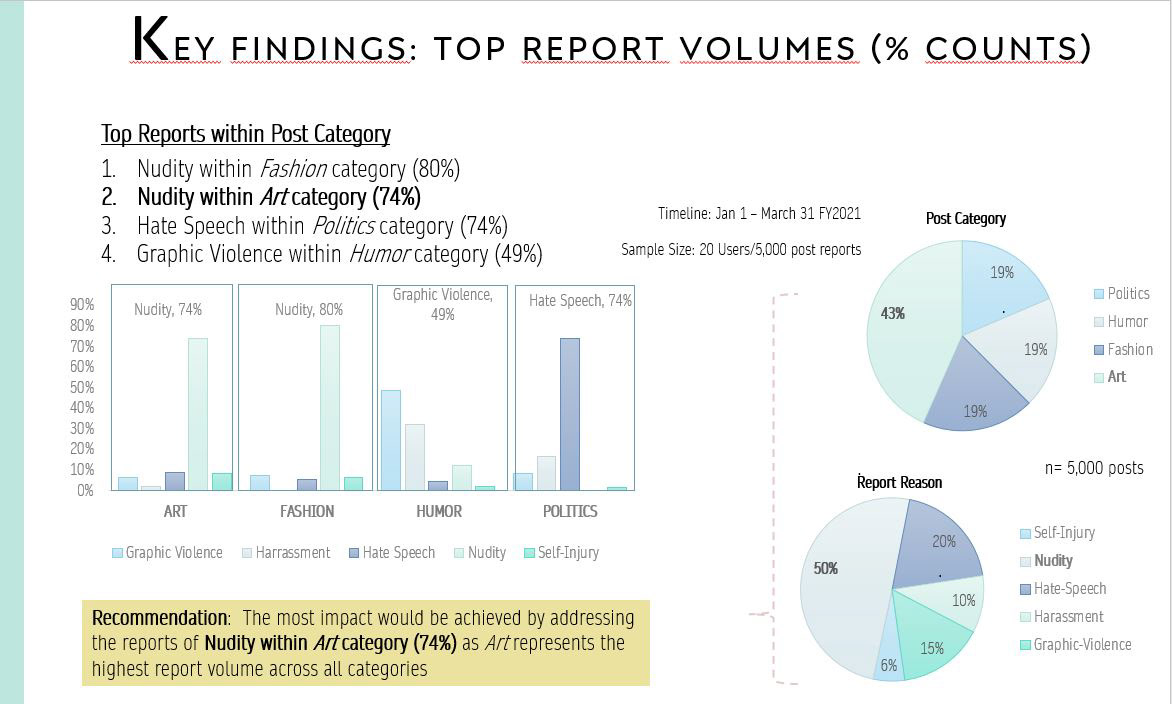
## Key findings - top report volumes
- ›Nudity within the Fashion category: 80%
- ›Nudity within the Art category: 74%
- ›Hate Speech within the Politics category: 74%
- ›Graphic Violence within the Humor category: 49%
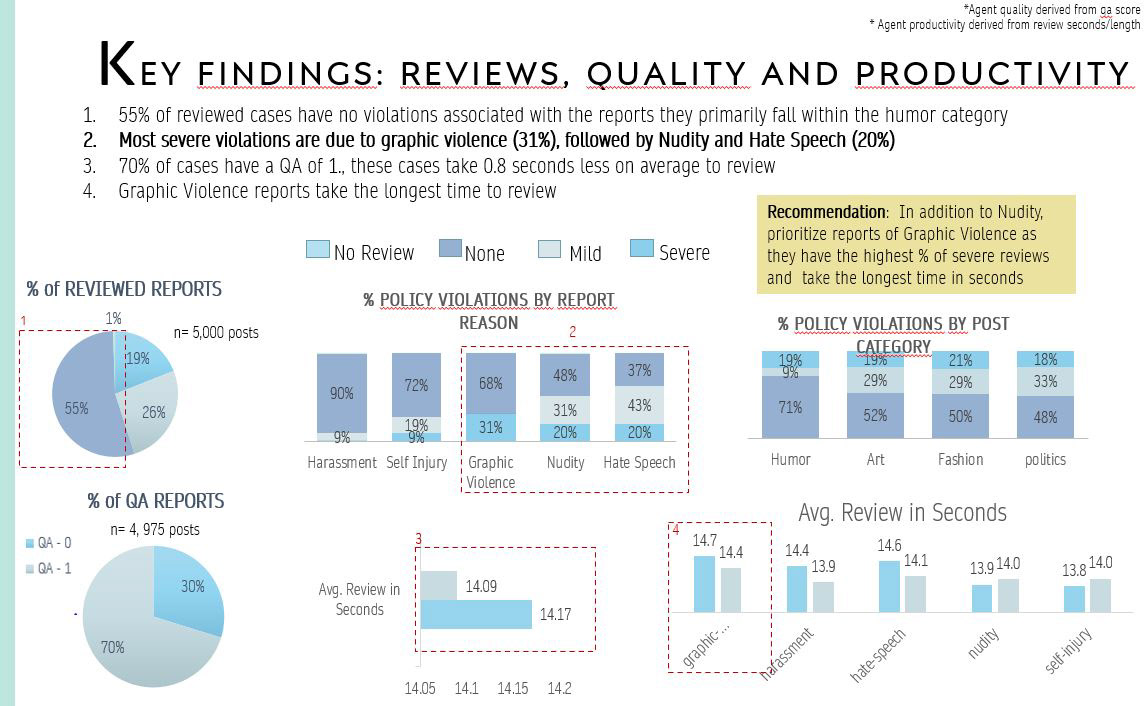
## Reviews, quality and productivity
- ›55% of reviewed cases have no violations associated with the reports; they primarily fall within the Humor category.
- ›Most severe violations are due to Graphic Violence (31%), followed by Nudity and Hate Speech (20%).
- ›70% of cases have a QA of 1. The slide states these cases take 0.8 seconds less on average to review; its plotted averages are 14.09 versus 14.17 seconds (a 0.08-second difference). Both original values are preserved here rather than silently resolving the discrepancy.
- ›Graphic Violence reports take the longest time to review.
- ›Agent quality is derived from QA score; agent productivity is derived from review seconds/length. QA results cover 4,975 posts.
## Recommendation
In addition to Nudity, prioritize reports of Graphic Violence, as they have the highest percentage of severe reviews and take the longest time in seconds.
- year
- 2023
- status
- Analysis
- tags
- Trust & safetyOperations analytics